| 2021 | 2022 | ||||||
| Price: | 7.42 | EPS | 0.07 | 0.28 | |||
| Shares Out. (in M): | 220 | P/E | 103x | 25x | |||
| Market Cap (in $M): | 1,957 | P/FCF | 17x | 14x | |||
| Net Debt (in $M): | 689 | EBIT | 82 | 145 | |||
| TEV (in $M): | 2 | TEV/EBIT | 26x | 15x | |||
Sign up for free guest access to view investment idea with a 45 days delay.
Description

Subject: AmRest Holdings S.E. (ticker: EAT)
Recommendation: Long
Base Case Price Target: EUR 11.85 (66% Upside)
Base Case 5 Year IRR: 25%
Recommend initiating a long-term position in EAT with a 1-year PT of EUR 12. While exposure to Europe has caused AmRest to lag QSR peers SSS, AUV, and profit recoveries, this is more than reflected in EAT's valuation and share price underperformance vs. peers. COVID provides a unique opportunity to own an asset with best-in-class unit growth, and EBITDA growth with robust unit-level economics.
Current share price of EUR 7.11 implies 67% upside to 1-year PT of EUR 11.85 and a 25% 5-year IRR assuming a beginning of 2026 exit. The IRR Increases to 40% assuming a beginning of 2023 exit.


Financial Summary and Estimates

Note: Our EBITDA Estimates are on a pre-IFRS 16 Basis and Subtract out Estimated Lease Expenses
Business Overview
AmRest Holdings S.E. (EAT), headquartered in Madrid Spain (though founded in Poland in 1993 and headquartered there until 2017), is a franchisee as well as master franchisor of well-known American QSR brands such as KFC, Pizza Hut, Starbucks, and Burger King in Central Europe, Eastern Europe, Western Europe, and Russia. The company also owns and operates a handful of smaller propietary brands though these are relatively insignificant from a consolidated perspective. In many of its markets, AmRest also acts as a franchisor of Pizza Hut, Starbucks, and the company's propietary brands, collecting royalties from franchisees/sub-franchisees who own and operate the restaurants. As of their 4Q20 earnings report, EAT owned and operated 1,858 restaurants with an additional 479 franchisee-owned restaurants. - Key competitors include: McDonald's (and the company's various franchisees across Europe), Alsea, Domino's, and a plethora of local chain and mom n' pop competitors across various segments of the restaurant industry.


Business Quality and Benchmarking
Robust Unit Economics and ROIC Profile: While EAT's ROIC has trended down somewhat in recent years, this is mainly driven by the acquisition of Starbucks assets in Germany in 2016 which management stated would require a 3-5 year turnaround timeline. Excluding this acquisition, EAT's Pre-TAX ROIC stood at a healthy 14% in 2019 with a cumulative pre-tax return on incremental invested capital of ~18%. Our analysis of EAT's new-build disclosures combined with primary diligence suggests a 20%+ cash on cash return profile (~5 year payback period) for EAT's new-builds across most brands and markets.
EAT ROIC (Unadjusted)


Best-in-Class Unit, Revenue, and EBITDA Growth
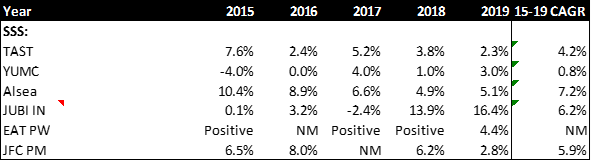
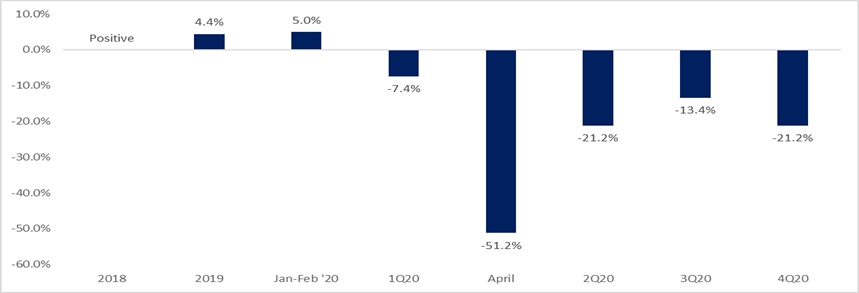
EAT has historically had strong 20%+ top line growth and 19% EBITDA growth with the difference being driven by acquisitions of turnaround assets in France and Germany. WEAT's Revenue and Unit Growth profiles are both at the top of it's peer set while EBITDA growth is near best-in-class peers. hile historically EAT did not disclose exact details of its SSS growth profile, our primary diligence suggests that the company consistently experienced positive SSS growth across its core markets in Central and Eastern Europe. The disclosed 4.4% growth rate for 2019 is also very healthy. While disclosures are somewhat limited, EAT has historically grown organic units, revenue and EBITDA at healthy DD%+ rates for the last several years as well.
2015-2019 Unit CAGR

2015-2019 Revenue CAGR

2015-2019 EBITDA CAGR
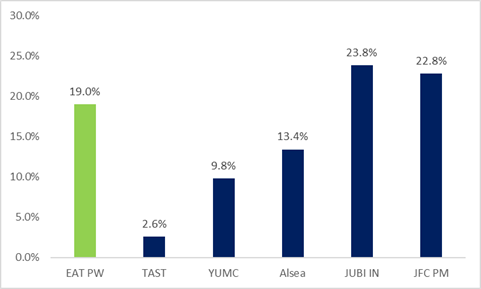
Same Store Sales Growth
EAT Organic Unit Growth

EAT Organic Revenue Growth

EAT Organic EBITDA Growth

QSR in Europe is Significantly Underpenetrated and EAT Enjoys an Expansive TAM Runway: The consumer wallet share spent on eating out in most European markets significantly lags the leading markets of Spain and Ireland (which are near US levels) showing the massive long-term term opportunity for Food-Away-from-Home to take share of wallet and stomach. Within Food-Away-From-Home, the penetration of Limited Service Restaurants also significantly lags US levels further showing the opportunity for QSRs to take share. An analysis of EAT's QSR brand penetration in key current markets suggests there is a significant runway to continue building >200 restaurants per year for next 5-10 years at least.
QSR Sales in Europe are Expected to Continue at an MSD% Clip for the Foreseeable Future
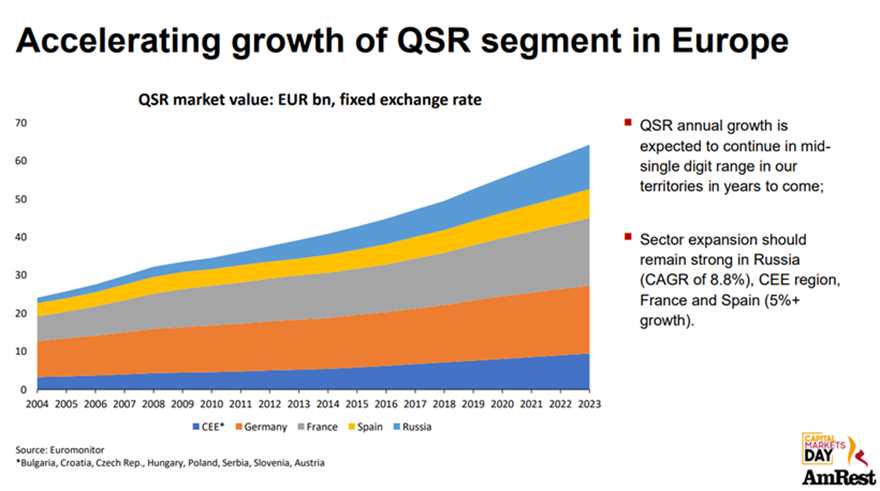
Source: AmRest 2019 CMD Deck
Driven by Massive Wallet Share Opportunity for Limited Service Restaurants in Europe

Source: Aaron Allen Consultants
Consumer Wallet Share for Eating out is Significantly Below Spanish Levels (Which Closely Resemble the US in Most of EAT's Markets) Illustrating the Long-Term Opportunity - Green bars represent EAT's key markets.

Source: EuroStat
Significant gap to MCD in EAT's Markets Suggests an Opportunity to more than Double the Number of KFC Units
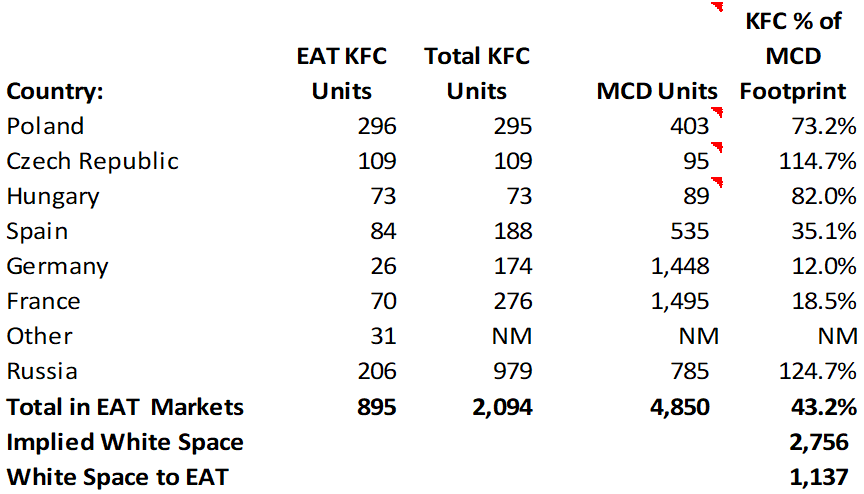
Source: Company Filings
Aassuming PH Penetration in EAT's Key Markets can Converge to Levels Seen Comparable Markets Implies an Opportunity to add an Additional 800+ PH Units Over Time


Source: EAT and YUM Company Filings
Aassuming Starbucks Penetration in EAT's Key Markets can Converge to Levels Seen Comparable Markets Implies an Opportunity to add an Additional 450+ Starbucks Units Over Time


Source: EAT and SBUX Company Filings
COVID Crisis and Opportunity
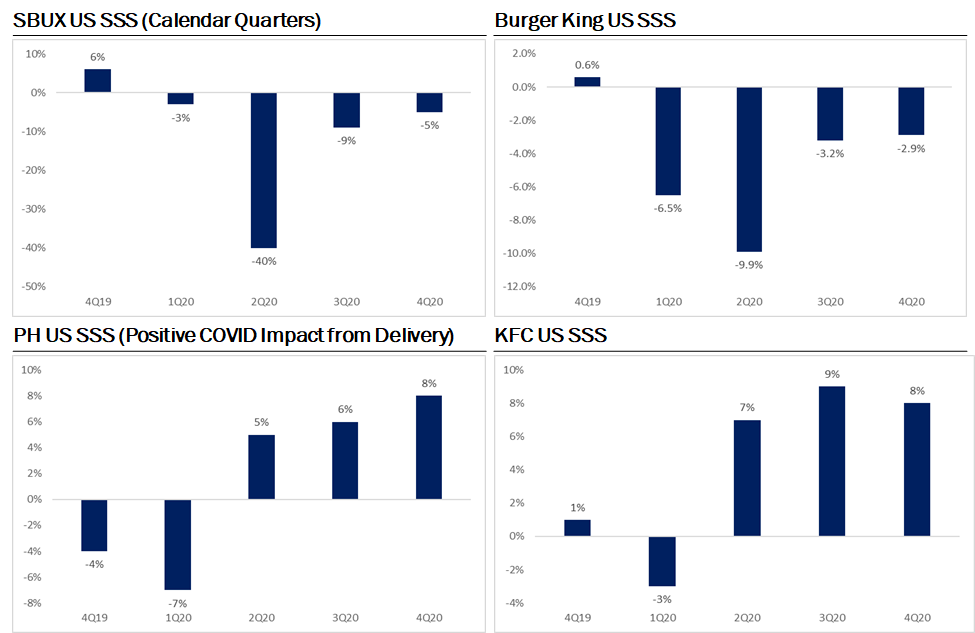
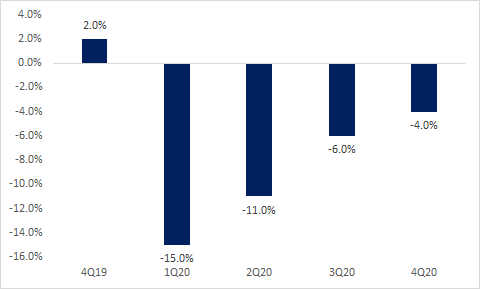
Despite robust asset quality and unit economics, EAT has lagged peers recovery from COVID due to its exposure to Europe which has been slower to reopen than the US and Chinese markets.The recovery in QSR Industry SSS in the US and China provide reason for optimism that once COVID restrictions are relaxed, and vaccines are distributed, the European consumer will return to EAT's restaurants. The relative delay in recovery is more than reflected in EAT's valuation, which clearly assumes a multi-year recovery period to return to 2019 EBITDA. It is important to note that EAT is not burning cash in the current -20% SSS environment as the company's cumulative FCF from 2Q-4Q20 was roughly breakeven.
EAT SSS: Recovery has Lagged Peers
US QSR SSS
YUMC Blended SSS
EV/2019 EBITDA

Source: Company Filings and Bloomberg
EAT has Historically Traded at an EV/NTM EBITDA of 12.3x

Source: Bloomberg
Despire the obvious headwind to COVID 19 on sales, the crisis has provided restaurants with a once in a generation opportunity to re-examine their cost structures and eliminate non-value-added operating expenses. This was evident in EAT's own 3Q20 results when consolidated EBITDA margins increased 30 bps despite having SSS that were -13%. Management has closed underperforming and cash flow negative stores that will cumulatively total ~6% of the system in 2020-2021 and commented that they have realized permanent cost savings during COVID that should result in a higher margin profile going forward:
Valuation
We estimate that 2022 AUVs will return to 2019 levels, that 2022 EBITDA margins will be essentially in-line with 2019 levels, and that EAT will build ~200 units (incl. franchised in 2022) which is roughly in-line with the 2019 level of new-builds. This leads to 2022 EBITDA of EUR 260m which is ~15% above 2019's EUR 224m.
A future share price analysis results in a 25% Base Case 5-Year IRR assuming the EAT investment is exited at 12x EV/NTM EBITDA in the beginning of 2026 or a 66% IRR/total return assuming a beginning of 2022 exit at 12x 2022 EBITDA. IRR math assumes the investment is entered into at the beginning of 2021.

EAT Historically Traded at an Average Multiple of 12.3x
Source: Bloomberg
Risks and Mitigants
Financial Leverage and Covenants: Since the outbreak of COVID, AmRest had been seeking quarterly covenant waivers from its banking partners.
Mitigant: AmRest announced on their 4Q20 Earnings Call that htey had received leverage covenant waivers from their banking partners for the next 3 quarters.
Cash Flow Burn: AmRest has not historically generated significant FCF and burned EUR 31m of cash at the height of the COVID lockdown in Q1.
Mitigant: Adjusting for growth capex, AmRest has historically generated significant FCF. Significant Growth Capex is an investment positive givne EAT's attractive rates of return on incremental invested capital.
Mitigant: AmRest was roughly FCF breakeven from 2Q20-4Q20 despite experiencing SSS of roughly -20%
COVID recovery could be slower than expected: Chopiness in the vaccine rollout and in consumer sentiment could lead to a volatile sales/earnings recovery in 2021.
Mitigant: There are significant positive offsets from competitor closures, off-premise stickiness, and likely pent-up consumer demand.
Other Considerations
Grupo Finaccess, a Mexican Private Equity firm backed by the family that sold Grupo Modelo to ABI, owns 67% of AmRest which limits trading liquidity. AmRest trades in both Poland and Spain though the Polish listing (WSE: EAT) has significantly better liquidity. Finaccess are long term investors in AmRest having first acquired a 32% minority stake in 2015 from Warburg Pincus. Finaccess has since built a 67% stake in AmRest. Finaccess also owns a 75% stake in Restaurant Brands (RBD NZ), a YUM franchisee focused on developing YUM branded restaurants in the ANZ region.
I and/or others I advise hold a material investment in the issuer's securities.
Catalyst
As the current vaccination campaigns in Europe continue, we expect an easing of restrictions and improvement in consumer sentiment this summer which should lead to improved sales and cash flow for EAT and a re-rating in the share price.
| show sort by |