| 2015 | 2016 | ||||||
| Price: | 52.53 | EPS | 3.06 | 0 | |||
| Shares Out. (in M): | 203 | P/E | 17 | 0 | |||
| Market Cap (in $M): | 10,644 | P/FCF | 0 | 0 | |||
| Net Debt (in $M): | 9,134 | EBIT | 0 | 0 | |||
| TEV (in $M): | 19,778 | TEV/EBIT | 0 | 0 | |||
Sign up for free guest access to view investment idea with a 45 days delay.
- Financial services
- Auto Dealer
- Scale advantages
- Automobiles
- Fragmented market
- CARMAX INC KMX S 04/14/2023
- CARMAX INC KMX 04/19/2022
- CARMAX INC KMX 08/07/2019
- CARMAX INC KMX S 01/27/2017
- CarMax KMX S 04/09/2010
- BETA
- PERRIGO CO PLC PRGO 03/08/2016
- cars.com CARS 09/11/2020
- Circuit City CC 02/26/2002
- CARVANA CO-REDH CVNA S 05/04/2017
- Grocery Outlet Holding Corp GO 01/09/2023
- GROCERY OUTLET HLDNG CORP GO 09/28/2021
- FIVE BELOW INC FIVE 04/08/2020
- CARS.COM INC CARS 07/20/2017
Description
SUMMARY for those lazy enough to read the HIGHLIGHTS
For 17x 2016 earnings you have the opportunity to own the used car dealer CarMax (KMX), which I think is a long-term compelling investment opportunity. Industry largest player + strong customer & shareholder orientation + >12% store count growth in the next 2 years + Mr Market myopia on operating leverage and focus on short-term issues resulting in mispricing.
HIGHLIGHTS for those lazy enough to read the whole case
I believe KMX’s competitive advantages and growth plan will boost EPS in the upcoming years. More importantly the stock price does not fully reflect this EPS increase.
-
Strong competitive advantages.- Industry largest player by far. Scale is very relevant. As opposed to other smaller dealers KMX also provides auto finance to its customers and then can drive volumes more easily.
-
Growth opportunity.- KMX sells less than 3% of the used cars in the US. The used car dealer market is fragmented and consolidating. The company is well-positioned to capture a higher market share driven by product-mix tailwinds and aggressive growth on the store-count by opening 13-16 stores on each of the next two years.
-
Strong customer orientation.- No haggle-prices make the sales process more convenient. Salesmen earn a fixed-dollar amount per unit sold, which aligns the interests of KMX and its customers.
-
Friendly corporate culture in a decentralized structure that makes every store manager accountable. Frugal and hands on-management. Like other senior managers, the charismatic CEO Tom Folliard has spent over 20 years at Carmax. This 2 min video is pretty good: https://www.youtube.com/watch?v=Eqb_k3-gsmQ
-
Long-term shareholder orientation.- KPIs largely based on hurdle rates on gross profit per car and return on capital at a store level. The company has never closed a store. The share count has dropped >10% in the last 3 years.
-
Market misperceptions
o Mr. Market often misprices operating leverage. And KMX’s store unit underlying economics certainly show notable operating leverage. Indeed, KMX as a whole – not only at the store level – is a story of constant operating leverage.
o Strong focus on temporary factors, namely recent hike on rates and a weak Q3.
o Some sell-side auto analysts seem to not get the “dealer + lender” model and they usually lack strong experience on consumer finance. Despite making some valid points I respectfully disagree with lys615’s 2010 short thesis on VIC, which seems to not understand how terrific KMX’s economics are.
QUICK HISTORY REMARKS
KMX opened its first store in Virginia in 1993 operating as a division of Circuit City, then a leading player in the US consumer electronics market as far as I know. Despite KMX was publicly traded since 1997 as a tracking stock of its parent company it was not till late 2002 when it became fully independent upon it spun-off. Ironically KMX has evolved into a great business while its parent company liquidated in 2009 victim of the online retail era. EBIT and EPS have compounded at 12 and 17% annually since the spin-off. Unsurprisingly book value per share and the stock price have gone up by 6 and 7x respectively.
KMX MARKET
Selling over 591K cars per year KMX is by far the largest used-car retailer in US while AutoNation is the runner-up. Incidentally AutoNation, with Bill Gates and Eddie Lampert as significant shareholders, is the largest car retailer yet it focuses on new cars. KMX’s sales of used cars more than double AutoNation’s and also top those of its third, fourth and fifth comps combined.
Upon Berkshire’s acquisition in late 2014 of the largest privately held new-car dealership in the US, Van Tuyl, Buffett stated that the car dealership business is very local, with no apparent scale advantages. I could not agree more with him. A new Audi A3 is the same product in either Arizona or Michigan. But when it comes to used vehicles, age, mileage and condition de-commoditize the product and size matters a lot. Consumers are picky. They specifically want that blue 10K-mile BMW 3 series equipped with ultimate fashion upholstery. The dealer with larger footprint has a broader inventory base to meet customer preferences, evidenced by the fact that ~40% of KMX’s sales are interstate.
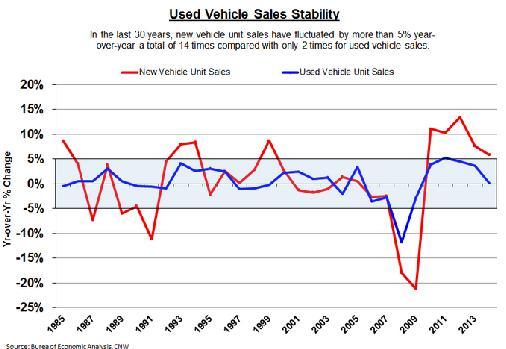
Additional to the fact that all used cars are unique, the lack of extreme sales volatility for used units as opposed to new ones is one of the things that originally attracted CarMax to the market. This is mostly the result of the less cyclical demand as one of every five used cars turns hands every year essentially regardless economic conditions.
Comparisons are far from perfect as new vehicle sales are reported every month and it is more difficult to exactly estimate used vehicle sales but I think they serve quite well the purpose of explaining that difference. Prior to the Great Recession new vehicle unit sales went as high as 17 million annually in 2005, fell dramatically to 10.4 million by 2009 and are estimated to end this year close the previous level of 17 million amid economic recovery, long lasting low interest rates and government incentives such as the Cash for Clunkers. Used vehicle annual unit sales were 44 million in 2005, 35 million in 2009 and 39-40 million in 2014. I don't have an estimate for this year yet but truly think sales are increasing.
Critical to KMX’s growth strategy, the used car market is very fragmented. KMX focuses on the new-end, that is 0-10 year-old cars with
The extremely fragmented market has collaterally led to steady consolidation over the last decade as increasing regulation, swings in local demand and rapidly depreciating inventory have pushed many small dealers out of business. In 2003 there were as many as ~54,000
independent dealers compared with the current 35,000. High up-front costs in fixed assets and inventory force new entrants to operate at high capacity and reach scale rapidly.
Motivated by reducing cyclicality, established franchised dealers trying to get into the used vehicle market also face barriers. In fact most of them cannot forward integrate profitably, AutoNation being the most remarkable exception. Uniqueness and reconditioning are both exclusive of used cars and they require significant capital and know-how.
BUSINESS MODEL
KMX operates in two segments: sales operations and auto finance (aka CAF). The fact that KMX offers an in-house financing option makes the sale process more convenient. I believe this gives KMX an advantage over dealers that lack a financing arm. KMX is essentially a spread business from both sides. It buys cars at a price and then sells these cars for a higher price. It gets funds at some rate and then finances its customers at higher rates.
KMX appraises the vehicles it buys - based on age, mileage and condition - and if they meet KMX’s quality standards are reconditioned and left for sale to retail customers. Most of the supply of vehicles KMX gets directly comes from consumers and marginally from auctions and wholesalers. Unlike other dealers, KMX guarantees an offer to buy any vehicle regardless the owner purchases a vehicle from the company on exchange, allowing KMX to offer access to a much larger selection of vehicles than any traditional auto retailer following the trade in-trade out model. The large and diverse customer and supplier base essentially translates into virtually zero bargaining power for them.
The company approach to car buyers is different to the industry standard. No-haggle pricing removes a frequent customer frustration, the fact a customer is given a price and is not the final price – obviously higher but only disclosed after the client relishes for the acquisition of the car. With KMX you pay what you see first. More importantly KMX’s sales consultants are paid commissions on a fixed dollars-per-unit basis, thereby earning the same commission regardless the vehicle being sold, the amount a customer finances or the related interest rate on the loan. This pay structure clearly aligns interests of salesmen and clients.
Wholesale
Had not the vehicles pass the appraisal test they are sold to licensed dealers through 62 on-site wholesale auctions, most of which are located at production stores. So in addition to the 591K retail cars KMX sold in fiscal 2015 a striking 376K via wholesale.
In contrast to the highly fragmented used vehicle retail market, KMX’s two primary competitors in the auto auction market, KAR Auction Services and Manheim, comprise circ. 70% of the North American auction market. However these competitors auction vehicles of all ages, while KMX’s auctions predominantly sell older, higher mileage vehicles.
Amongst other reasons the oligopolistic nature of the wholesale market makes it possible for KMX to own all the vehicles it sells in those auctions, rapidly disposing cars as its 97% average auction sales rate suggests and then reducing inventory depreciation risk.
I find wholesale particularly interesting amid higher gross and net margins despite lower $ value. As most target clients are expert dealers themselves looking for older cars, KMX does not need to deploy neither as much sales personnel as in its retail operations nor it does need to spend as much in reconditioning. I think there is further inventory turnover ahead and therefore KMX can benefit from further operating leverage.
|
2005 |
2006 |
2007 |
2008 |
2009 |
2010 |
2011 |
2012 |
2013 |
2014 |
2015 |
|
|
Retail Units Sold |
253,168 |
289,888 |
337,021 |
377,244 |
345,465 |
357,129 |
396,181 |
408,080 |
447,728 |
526,929 |
582,282 |
|
Av. Unit Selling Price Retail |
$15,663 |
$16,298 |
$17,249 |
$17,298 |
$16,291 |
$17,152 |
$18,019 |
$18,995 |
$19,351 |
$19,408 |
$19,897 |
|
Gross Profit Retail Unit |
$1,817 |
$1,808 |
$1,903 |
$1,878 |
$1,865 |
$2,072 |
$2,156 |
$2,177 |
$2,170 |
$2,171 |
$2,179 |
|
Other Gross Profit Retail Unit (1) |
$366 |
$391 |
$431 |
$437 |
$427 |
$495 |
$502 |
$438 |
$395 |
$349 |
$420 |
|
Total GP |
$2,183 |
$2,199 |
$2,334 |
$2,315 |
$2,292 |
$2,567 |
$2,658 |
$2,615 |
$2,565 |
$2,520 |
$2,599 |
|
Gross Margin Retail |
13.9% |
13.5% |
13.5% |
13.4% |
14.1% |
15.0% |
14.8% |
13.8% |
13.3% |
13.0% |
13.1% |
|
Wholesale Units Sold |
155,393 |
179,548 |
208,959 |
222,406 |
194,081 |
197,382 |
263,061 |
316,649 |
324,779 |
342,576 |
376,186 |
|
Av. Unit Selling Price Wholesale |
$3,712 |
$4,233 |
$4,286 |
$4,319 |
$3,902 |
$4,155 |
$4,816 |
$5,291 |
$5,268 |
$5,160 |
$5,273 |
|
GP Wholesale Unit |
$464 |
$700 |
$742 |
$794 |
$837 |
$869 |
$908 |
$953 |
$949 |
$916 |
$970 |
|
Gross Margin Wholesale |
12.5% |
16.5% |
17.3% |
18.4% |
21.5% |
20.9% |
18.9% |
18.0% |
18.0% |
17.8% |
18.4% |

Source: Some Numbers & Metric from CarMax 10-K 2015 and other numbers from Manheim’s. (1) Includes the profits on the sale of extended service plans, guaranteed asset protection, service department sales, and third-party finance fees, net.
CarMax AutoFinance (CAF)
CAF provides financing solely to customers of KMX, who also have other financing options either because of their own choice or because they do not qualify for CAF credit standards. CAF itself provide financing more geared towards prime customers yet it also provides funds to clients with lower creditworthiness. For non-qualifying customers CAF has also agreements with Tier 2 (non-prime) and Tier 3 lenders (subprime).
-
25-30% of KMX’s customers use financing that they obtain outside KMX channel, like from a bank or credit union.
-
A negligible portion pays with own savings up front. I confirmed this has always been the case, which essentially discards the idea of ultralow interest rates fuelling a temporary preference for loans over cash.
-
Approximately 40% of KMX customers are financed by CAF, a proportion that has steadily increased over time – in 2010 less than 30% of end clients used CAF financing. I think the increase is mostly a result of two factors. First, improving economic conditions have pushed more clients to qualify as prime borrowers. More importantly, CAF has improved its underwriting and execution processes over time. Piling data over time allows for better assessment of creditworthiness and more agile billing, collection and repossession vs. outside comps in both prime and non-prime segments, which has made it possible for CAF to offer more competitive financing options. I do not think this increase in share to be the result of loosening credit standards, as FICO score remains stable ~700 with no significant changes in its calculation or % of total outstanding receivables included.
-
The remainder of KMX’s sales, that is 30-35%, are financed by Tier 2 lenders or Tier 3 lenders through KMX sales channel. Despite it is not central to the thesis I could not get penetration by lender from any source. More relevant I talked to the largest lender by far, Santander, as it lends in both Tier 2 and 3 and also is the largest in Tier 3 standalone. Santander has an incentive to underwrite through KMX channel because its losses are lower, primarily due to transparency (KMX knows what the vehicle is really worth) and quality (all KMX vehicles are reconditioned at least to some extent).
I provide the list of Tier 2 and Tier 3 lenders just if you want to talk to any of them about their incentives to use CarMax sales channel and their satisfaction level. But I think their response and incentives will be quite similar to those of Santander.
Tier 2: Wells Fargo, Capital One, Santander, Exeter and Ally
Tier 3: Santander, American Credit Acceptance and Westlake
I think that CAF’s share on total financing options will keep growing, enhancing an alternative engine growth, fuelling unit sales and without incurring in significantly higher risk on its balance sheet amid its securitization program. Also more lenders are likely to ascribe to channelling though KMX as they see the benefits of a more qualified opinion on credit risk.
CAF Securitization.- With the exception of the subprime test - which residually comprises <0.5% of CAF financing and is kept on the balance sheet - CAF finances all through the ABS market after securitizing the loans for the short term in two warehouse facilities.
Moody’s and S&P rate these ABS deals as AAA and currently the company is only required to hold less than 1% of the securitizations as “skin in the game” during the life of the deal: 25 bps in restricted cash and 50 bps in receivables (over-collateralization). These low requirements derived from high-lending standards let for lower-risk loan book expansion.
In addition CAF manages losses on each individual ABS deal and monitors them closely. I believe that throughout the years CAF has been securitizing - starting in 1999- the highest loss ratio has been an annual 2% or so on two or three of the securitizations during the Great Recession. At that point, CAF tightened credit and pulled the overall average back down to 0.7%. As the ABS market bounced back and CAF could lend again to the lower level credits, average losses grew back to the 1% historical level.
CAF’s net interest margin - the spread between interests & fees charged to KMX customers and funding costs in the ABS market - has historically averaged about 5% since 2003, which I find reasonably good for the period. During the financial crisis net interest margin for some securitizations was even >8% as CAF benefited from the virtual shutdown of the credit markets. CAF was clearly overearning those 2-3 years back then. Since then margin has slowly falling back to normal historical levels, with the last ABS deals at 5.5% or so, which would indicate if nothing changes that the margin for the whole portfolio of receivables will continue to decline on the next quarters to the 5.5% level or slightly below – Q2 still showed a 6.2% margin.
I think this change in the ABS portfolio mix resulting in lower margins in the future, but especially the recent hike in interest rates has triggered concerns on CAF margin pressure. I see it just as a temporary issue. CAF Margins are likely to get squeezed further, sure. But CAF is already trying to pass through the higher funding costs to consumers. Obviously it is all a matter of the market and what other lenders are doing (although I guarantee they want to pass it through as well – auto lending is a very profitable source of income for them) but generally CAF pass it through over a period of months as far as I have seen in the past. After that this clouds are deemed to disappear.
ABS deals do not pose much of concentration risk either. A high number of buyers of these securities have been loyal to KMX for years, mostly insurance companies and money managers. I guess AAA rating helps a lot in terms of what can be included in an institutional portfolio and what cannot, another advantage of KMX over smaller lenders in terms of both addressable clients and cost of funds.
STORE ECONOMICS
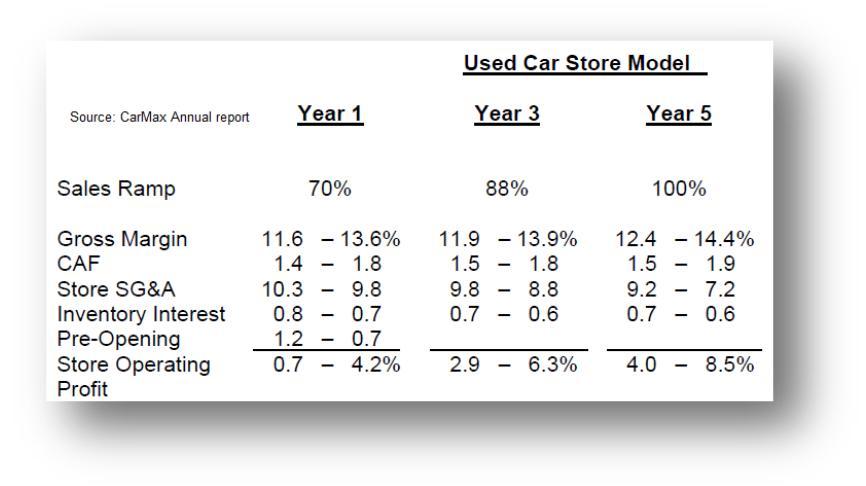
Every KMX’s store needs a 5-year period on average to ramp up to a so called “initial maturity” stage. In year 1 a store usually sells 65-70% of the units it expects to sell in year 5. That speedy ramp-up of capacity makes it possible to break even cash-on-cash after year 1.
A store grows considerably faster in the initial maturity phase, but is still meant to compound after that period based largely on population growth and market share expansion.
Though a store is expected to grow faster in the first 5 years obviously it will not be as efficient, given that approximately 70% of SG&A costs are fixed and largely in place in year 1. The average cost of a traditional store model rounds $20m+ $3-5 in inventory expense.
The recently rolled out small format costs about a third as much, but is expected to sell at maturity between 75-125 cars/month vs. the traditional model, which currently sells on average 360 vehicles/month and benefits from better unit economics as a result.
KMX imposes a strict discipline in terms of store profitability. In order to acquire real estate it should meet quite a few goals. Namely to be visible and accessible from the freeway, to be located near other dealers or big box retailers, to be priced at a level that allows KMX to achieve a specific return hurtle rate and to achieve the projected sales level at the end of year 5, given the demographics within a 10 mile radius of the location and up to 50 miles away. KMX uses the same hurdle rate for the traditional and small format stores, yet some stores are obviously more profitable than others. The company has never closed a store.
CURRENT SITUATION
Q3 earnings disappointed with comparable sales and net income slightly decreasing by 0.8 and 1.4% YoY respectively. The stock price was 6% down on the day.
Two temporary factors contributed to depress earnings, namely a modest decrease in store traffic and one-off advertising expenses (for new store openings) whose accounting timing was unclear. Both factors are unimportant from my perspective and will certainly move away. More importantly the conversion rate from the store traffic continues to increase every day.
INVESTMENT THESIS
KMX will continue to roll out its ambitious store growth plan that has historically pursued. The current plan is to open 13-16 stores for each fiscal 2017 and 18 and 3 more for the remaining 2016. After 2017, assuming 8 stores per year seems quite conservative as KMX currently reaches just 60% of the total market and has about 5% market share in the markets is in and around oldest 8 - 10% in the oldest markets. Of the 155 stores it operates more than half are based in large markets (>3m population), 40% in mid-sized markets (600K to 3m people) and the rest 4% in small markets (<600K). With the visibility of 2016 and 2017 openings these percentages are likely to be quite similar in the future.

|
Remaining Fiscal 2016 |
||||
|
Bloom ington |
Peoria/Bloom ington |
Illinois |
Q4 |
Small |
|
Buford |
Atlanta |
Georgia |
Q4 |
Large |
|
O'Fallon |
St. Louis |
Missouri |
Q4 |
Mid-Size |
|
Fiscal 2017 (FYE 2/28/17) |
||||
|
Springfield |
Champaign/Springfield |
Illinois |
Q1 |
Mid-Size |
|
Pleasanton |
San Francisco |
California |
Q1 |
Large |
|
El Paso |
El Paso |
Texas |
Q2 |
Mid-Size |
|
Westborough |
Boston |
Massachusetts |
Q2 |
Large |
|
Fremont |
San Francisco |
California |
Q2 |
Large |
|
Santa Rosa |
San Francisco |
California |
Q2 |
Large |
|
Bristol |
Tri-Cities Tenn/Va |
Tennessee |
Q2 |
Mid-Size |
|
Boise |
Boise |
Idaho |
Q3 |
Large |
|
Maple Shade |
Philadelphia |
New Jersey |
Q3 |
Large |
|
Daytona |
Orlando |
Florida |
Q3 |
Large |
|
Grand Rapids |
Grand Rapids/Kalamazoo |
Michigan |
Q3 |
Mid-Size |
Mid-Sized are more likely to have the traditional store model, usually are far from the saturation point. I find more likely for the large markets (except for the San Francisco Bay area, a new large market for the company, and few others) to embrace the new smaller store concept.
With 14 openings for each of the next 2 years, 3 still remaining this year and 8 from that point onwards we would have 3 openings in the remaining 2016 (2 traditional format openings & one small format), 14 in 2017 (7&7), 14 in 2018 (7&7) and 10 (5&5) from 2019 onwards assuming proximity of saturation in some existing markets. Given the up-fronts, average sales and ramp-up period in the store economic section is not so hard to roughly model this.
Operating leverage store roll-up plays a role at both like-for-like growth and SG&A level. Though obviously different amount, there is still operating leverage to be captured essentially in any store
Used vehicles are now selling on average above $20K, which is almost an all-time high, then new cars becoming more attractive in terms of opportunity cost. In addition, CAF will see some months of lower interest margins amid the Fed recent raised. These facts have raised some concerns on most analysts and market participants regarding margin pressure.
Needless to say I belong to the minority. It is surprising that some do not get there is actually a timing mismatch between the new and used models sold. In other words, used sales price lags that of new vehicles. It is not an apples-to-apples comparison. Indeed the lag tends to increase as the average length of new-vehicle ownership has been increasing to the current ~6 years, following that a notable proportion of the new cars sold since 2009 have not been resold yet and supply is still to come. Margins will expand as soon as ultimate higher margin vehicles show up in constant flow into the used market, as the company expects that more than 70% of the product mix will shift to the very last models soon during years. People are simply waiting for ultimate models to come. That is also the reason why inventory turnover is at 7x, roughly at the levels of the Great Depression and far from the >8x “good times” average. Certainly this increase in turnover will free cash. Does the market get all these dynamics? I doubt it.
I have also read a report from an investment bank – let stay apart who the culprit is – stating that KMX “financial position is weak”. It talks about 25-75 equity-assets leverage, stresses >$200m underfunding of pension obligations, $350m of operating leases that need to be capitalized and some other things that are technically correct but are details that totally ignore the relevant facts. >$7.5b is non-recourse debt linked to the ABS program in which CAF`s balance sheet is just required to hold 75bps on the total loan amount. ABS holders also know CAF portfolio is good quality so they are loyal. Some people might see leverage is a problem here. They feel it is too much. KMX off-balance sheeting business model makes me feel leverage is actually too little.
I think the management also does. Actually the management is using a revolving credit facility to fund expansion and has already used ~$1b (who would not with ROEs >15% and financial costs of 1-2%). A share buyback program is also in place. Since 2013 the company has almost bought $2.5b back, or >10% of outstanding shares. It has already in place a plan for $2b additional buybacks for 2016 (2017 fiscal). The average price KMX paid for the last $2b in fiscal 2015 was ~$52 per share, so in line with the entry price of this write-up.
VALUATION
Interestingly CarMax does not need to deploy a lot of cash in the roll-out. Of the initial $20m on real estate + $3-5m in inventory expense for an average traditional store, CarMax just needs to front pay only about $3m. This is because KMX typically sales-leases back substantially all of the land and building investment within 6 to 12 months of opening and finances up ~90% of the inventory. The same thing happens in the smaller concept store, with only ~$1m investment needed.
Conservative Assumptions. These points below are potential upside not-included
-
Ramp up is complete for all the stores built until 2013
-
From 2019 on KMX will “just” opens 10 stores every year
-
Ramp-up Middle-points are not included in annual profits, that is to assume that stores ramp up straight from 70 to 100% sales
I think given the store count growth previously stated, the margin expansion and share buybacks EPS for fiscal 2019 (2018) will be ~$4 per share. Assuming no multiple expansions that is 10% IRR, or said in another way, KMX is selling for 13x F2019 earnings. However given the conservative assumptions and the possibility of a multiple expansion I would not be surprised if IRR will be closer to 15%, actually closer to KMX reinvestment returns.
|
70% ramp-up |
70 to 100% ramp-up |
2015 |
2016 |
2017E |
2018E |
2019E |
||||
|
Total Sales |
Initial |
Sales increase |
Store openings |
|||||||
|
Superstore |
84 |
59 |
25 |
Superstore |
9 |
8 |
9 |
7 |
5 |
|
|
Small format |
24 |
17 |
7 |
Small format |
4 |
3 |
8 |
7 |
5 |
|
|
Total Profit |
Initial |
Profit increase |
Sales Increase |
|||||||
|
3.36 |
1.18 |
2.18 |
Incremental Superstore |
825 |
||||||
|
1.2 |
0.425 |
0.775 |
incremental Small format |
154 |
||||||
|
Ramp-Up new 0-70% |
667 |
532 |
540 |
|||||||
|
Total Sales |
(Openings + incremental ramps ups) |
667 |
532 |
1519 |
||||||
|
Profits Increase |
||||||||||
|
PROJECTIONS |
Incremental Superstore |
71.9 |
||||||||
|
incremental Small format |
17.1 |
|||||||||
|
Ramp-Up new 0-70% |
14.02 |
11.235 |
22.8 |
|||||||
|
Total Profits |
(Openings + incremental ramps ups) |
14.02 |
11.235 |
111.8 |
||||||


MAIN RISKS
-
Macro risks
-
Consumer spending/disposable incomes drop, then drivers might delay vehicle purchases
o ABS and credit market freeze
-
Problems to fund growth plans
-
Online transparency & convenience makes challenges KMX no-haggle policy
-
Sharing vehicles and prospective self-driving cars high penetration could damage KMX’s model
I and/or others I advise hold a material investment in the issuer's securities.
Catalyst
New openings + operating leverage at both same store and SG&A levels
| show sort by |