GATX CORP GATX
S
March 08, 2018 - 9:34pm EST by
Pop4Pres
| 2018 | 2019 | ||||||
| Price: | 68.66 | EPS | 4.69 | 4.90 | |||
| Shares Out. (in M): | 39 | P/E | 15 | 14 | |||
| Market Cap (in $M): | 2,657 | P/FCF | nm | nm | |||
| Net Debt (in $M): | 4,080 | EBIT | 299 | 301 | |||
| TEV (in $M): | 6,296 | TEV/EBIT | 22 | 22 | |||
| Borrow Cost: | Available 0-15% cost | ||||||
Sign up for free guest access to view investment idea with a 45 days delay.
Description
Note: Numbers above are Street.
Note: Edits have been made vs. original VIC submission to correct model errors.
Capitalization

Estimates

Investment Thesis - Summary
-
Booming crude production in the Bakken and a lack of transport infrastructure created a boom in crude by rail and an extended period of above market lease rates, of which GATX was a beneficiary
-
Lease rates will more than normalize as railcar deliveries surpassed all prior peaks and demand for crude transportation will decline as cheaper pipeline replaces rail
-
Idle tank cars will be taken out of CBR and shifted to other customer segments pressuring rates for the whole industry
Investment Thesis - Detail
Crude by Rail Background
-
Crude by rail boomed in tandem with the shale revolution in the U.S. as lack of transport from the Bakken forced E&Ps to ship by rail as pipeline development lagged production (link)

-
The pipeline shortage created a boom for companies like TRN, ARII and other railcar OEMs, which saw ASPs for tank cars increase from $40k to $150k-$160k by 2015 (link)
-
Transporting crude oil by pipeline is cheaper than by rail, at a cost of about $5 a barrel (link) compared with $10 to $15 a barrel (link), according to a 2014 February report by the Congressional Research Service. Cost estimates vary with some saying $6-$8 a barrel for pipelines and $12-$15 a barrel by rail

-
Rail volumes have already been decimated as crude prices have declined, making the Bakken with its higher cost drilling and higher transport costs uneconomic, and as more pipeline capacity has been delivered (link):

Supply/Demand Shock Set the Stage for Record Lease Rates
-
GATX, which purchases railcars from the OEMs and leases them to customers was also a beneficiary as it was able to renew leases for the bulk of its tank car fleet (or maybe even the entire fleet?) at significantly higher lease rates
-
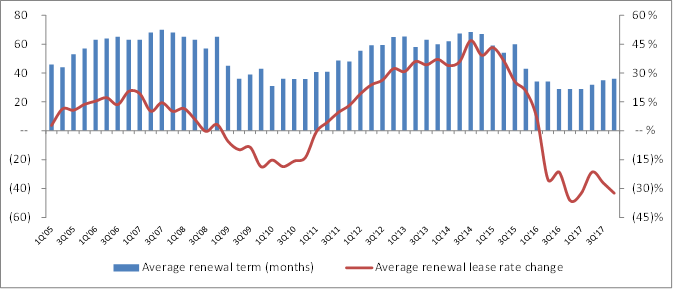
The company actually publishes its average renewal lease rate change and its average term on new leases, after a slight rebound rates are falling again
-
Changes in lease rates flow through to the bottom line - lease rate changes drive rail segment profitability

-
The average term has historically fluctuated between 35 and 65 months, suggesting ~3-5.5 years to refresh the whole lease book. Because renewals were typically done at ~65 months from 2006 to 2008 and ~35-45 months from 2009 to 2011, renewal volume was high in key shale years as CBR transport demand pushed rates up and lengthened terms for leases signed in 2012-2015

-
Effects are shown in the blended revenue / railcar for NA and on a consolidated basis in GATX financials:

-
The first of these leases are now coming due and GATX will have to renew at much lower rates, yet the stock is near all-time highs
-
In typical cyclical fashion, companies dramatically grew order books and deliveries

-
At one point the tank car backlog earmarked for crude by rail was equal to the entire existing CBR fleet
-
Market lease rates across GATX’s fleet mix suggested levels well below current blended portfolio rates GATX has achieved (~$690/car/month in 2016) and below prior trough given the excess deliveries to support the oil patch, which are being replaced by pipeline capacity and are forcing idle cars into GATX’s other end markets. Rate data are from a 2016 Railwayage.com (link) article (unfortunately I don't have more recent data here, so if anyone has please let me know):

-
Another way to triangulate rates is that the lease index has averaged -30% for the last seven quarters. If you assume that the book has to reset 30% lower on average, then from peak blended rates of $683 in 2016 you arrive at $478
-
In my opinion, blended lease rates will at best be at prior trough levels, but could overshoot to the downside given the slack in the market. EPS could decline to ~$2.00 at the trough on the reset lease book (peak P/E multiples at times of trough earnings have reached low-20x levels…vs. nearly $70 stock today). The below is a simple illustrative example and doesn’t adjust for other parts of a more complete model, but hits on the key driver going forward
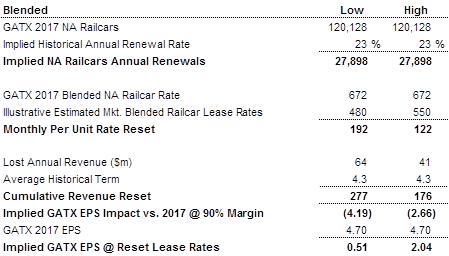
[Note: Previously, I was probably too aggressive on blended rates and had not adjusted for a 20% tax rate, which affects starting point for EPS and amount of lost profitability]
-
The company will likely take some SG&A out of the business as it did in the last cycle so trough EPS at the midpoint of the above range (rates of $515) is likely to head towards $2 or less (probably a 2020 event as the book takes time to turnover) vs. the Street at ~$4.90 in 2019
Fundamentals Already Weakening
-
The renewal rate resets show continued weakness, and declines have gotten sequentially worse
-
Lease terms have been approximately halved from a peak of ~68 months in H2 of 2014 to ~33 months on average in 2017
-
YoY revenue growth has been negative in each of the last seven quarters, was worse in 2017 than 2016 and was worse in Q4 than Q3
-
Trailing twelve month EBIT margins for the NA rail segment (largest profit contributor) have drifted down 500bps from 48% at Q4 of of 2015 to 43% at Q4 2017 (and the majority of above-market leases signed in 2014-2015 have not even rolled yet since terms averaged 60 months in those eight quarters)
Potentially Over-Stated Book Value
-
Rail segment assets have grown well above inflation, metal prices and crude prices, and lease rates are down dramatically, suggesting book value is over-stated

-
North American segment assets have grown ~40%, while the largest component of a railcars cost (steel) has grown 27% (mostly due to recent tariff talk and had been lower until very recently) and one of the most relevant cargoes of the last half decade (crude) has seen its price decline >30%
-
If NA railcar assets per NA railcar return to 2010-2012 levels as lease rates revert and cars need to be scrapped to deal with the tanker glut, then GATX’s assets could require a $1b write-off vs. book equity of ~$1.7b

High Leverage and Weak FCF Profile
-
>$4b+ in debt and net leverage ~5.4x EBITDA
-
GATX has a bad FCF profile, even if you give the company credit for “portfolio proceeds” which could evaporate as no buyers step up for tank cars. In the last ten years it has only generated positive FCF twice (in the 2015-2016 peak years)

Underfollowed by the Street
-
Only a few analysts from large banks (Citi and Wells Fargo) cover GATX and some from smaller banks like Cowen and Stephens
-
In almost all cases, analysts are in the transportation groups at the banks they are employed by, often with a focus on OEMs rather than lessors
-
GATX is tied to commodities given the effects of CBR on the railcar business
-
Energy analysts don’t cover GATX because of the company’s claims of low CBR exposure, its small market cap relative to the E&P and integrated oil sectors and its lack of public peers
Insider Sales
-
Insider ownership is not huge in the first place
-
Been selling among managers since the stock rallied to ~$60
-
A few notable sales
The Bull Case and Counterpoints
-
Only 2% of GATX fleet is CBR and only 2% is sand related to fracking
-
Counter: The company still benefited from inflated lease rates that led to record margins and will suffer from the glut of cars on the market as leases roll or CBR tankers move into other customer categories
-
-
Oil is going to bounce back
-
Counter: Shale players will ship by pipeline due to costs that are a third to a half lower than rail. Pipeline capacity will imminently exceed peak Bakken production
-
Valuation and Key Assumptions
-
Assume that blended NA lease rates reset as leases roll over the next four years from ~$672 in 2017 to ~$515 in 2020, which is ~$155m in revenue if ~80k cars turn over
-
NA utilization dips from 99% to 96% vs. 96% and 90% in the last two dips, which is another ~$30m in revenue
-
Incremental EBITDA margins are historically ~100% as changes in lease rates and utilization are entirely flow through
-
Implies EBIT margins of ~22% in 2020 vs. prior trough of ~24%
-
Implies EPS of ~$2.85 in 2019 and ~$1.96 in 2020 at peak multiple (see appendix for cyclicality of multiple vs. cyclicality of earnings) of ~20x for near bottom of the cycle = ~$40 share price on 2020 earnings or ~40% downside (trough in earnings likely in 2020 as full fleet moves onto to lower rate plans for the entire period)
-
The alternative valuation, would be to take the average PBV of the last 10 years of 1.6x, adjust the asset value per railcar in NA from $41k in 2017 to $33k from 2012 levels before CBR really drove up prices, which would result in an ~$970m write off (or ~50% of book equity), which would result in BV / share of $25 and a share price of $40 or ~40%
-
You pay a 2.5% dividend in the meantime
Pre-Mortem
-
Another commodity boom like the past ethanol boom that sucks up tank car supply
Appendix
-
Rail segment profit margins dropped from >30% to the low-teens last time terms weakened on the lease book, but declines have been more severe and essentially the entire over-priced lease book will come due in the next three years based on the average terms

-
Historical Utilization

-
Multiples


I do not hold a position with the issuer such as employment, directorship, or consultancy.
I and/or others I advise do not hold a material investment in the issuer's securities.
I and/or others I advise do not hold a material investment in the issuer's securities.
Catalyst
- Lease book renewals through 2020
| show sort by |