| 2018 | 2019 | ||||||
| Price: | 11.00 | EPS | 0.82 | 2.42 | |||
| Shares Out. (in M): | 12 | P/E | 13.4 | 4.5 | |||
| Market Cap (in $M): | 130 | P/FCF | nmf | nmf | |||
| Net Debt (in $M): | 23 | EBIT | 17 | 36 | |||
| TEV (in $M): | 153 | TEV/EBIT | 8.9 | 4.3 | |||
Sign up for free guest access to view investment idea with a 45 days delay.
- None found
- BETA
- CHESAPEAKE ENERGY CORP CHKEL 09/13/2021
- MCAFEE CORP MCFE 04/14/2021
- Universal Stainless USAP 02/23/2023
- Unit Corporation UNTC 04/30/2023
- Tandycrafts TAC 04/27/2000
- RANGE RESOURCES CORP RRC 02/05/2018
- GENIUS SPORTS LTD GENI 12/12/2023
- PRICE (T. ROWE) GROUP TROW 09/13/2018
- LEGACY RESERVES INC LGCY 10/17/2018
- ISHARES SHORT MAT BOND ETF NEAR 03/19/2020
Description
It’s cheaper to drill for gas on the floor of the New York Stock Exchange than it is in the field. At $11 per share Goodrich’s PDPs more than cover the entire enterprise value at the strip and you get the PUDs for free. The PUDs are good and they have 11.5 years of inventory at the current drilling pace. The recycle ratios are strong enough to generate production growth within cash flow at a 28% CAGR for nine years. I model the stock worth $22/sh at the strip in a development scenario where they only spend within cash flow after 2018, and $30/sh to an acquirer if you eliminate the G&A. Net debt/EBITDA is just 0.5x on my 2018 numbers.
This is the cheapest stock I know of by a mile. The implied EBITDA multiples at $11/sh are 2.7x for 2018 and 1.9x for 2019. It’s trading at 58% of PV-10, and their proved reserves only contain 60% of their undeveloped locations. Almost all E&P stocks in the unconventional era trade at material premiums to PV-10 because of their resource visibility which extends beyond the SEC five year window, including Tier 2 E&Ps with hair on them. There is virtually no geologic risk with GDP because almost all of their Haynesville acreage has been delineated, and all of it is held by production. Usually you have to take balance sheet risk or geologic risk to get an E&P stock this cheap.
The issue is liquidity. GDP only trades $500k/d. And, Franklin got a ton of stock in the Chapter 11 reorg. They still own 26% and have been selling. Since last May they have been 27% of the volume. (A big chunk came in a block trade on February 14. Excluding that day they have been 13% of the volume.) There are other reasons you can point to for an explanation as to why the stock is so cheap, but even when you control for those factors the valuation is an outlier.
The CEO’s Dad founded the company and he needs a win in order to set the record straight after going through bankruptcy. The stock is materially cheaper than any arm’s length transaction could occur at whether through corporate M&A or acreage transactions. This type of opportunity is something you can really only find in the stock market, but energy investors are numb and beaten down after three years of getting whipsawed, and generalists are afraid of the complexity. In this landscape who wants to buy an E&P you can’t get out of? Investors may have to eventually be forced to recognize value by Goodrich and other energy companies, whether through buybacks or M&A. Goodrich won’t be doing a buyback because they need to grow production to regain fixed cost leverage over their G&A, which they lost during the downturn even though they cut headcount by 50% as production fell 70% peak to trough. M&A is the remaining option. Management is very frank about recognizing the need to sell the company at some point if the stock market doesn’t eventually give them credit. I estimate the CEO and COO would receive change in control payouts of $13 million with a takeout at $20/sh.
E&P investing is often about betting on the jockey as much as the horse. It would be fair to ask whether the same guys who landed the company in bankruptcy are the right ones to lead investors to the promised land. I think the answer is yes. They don’t have the ability or goodwill to make the kinds of moves that often entail a high risk of value destruction, like entering new basins. The task before them is to execute in a play where they have a lot of history and then exit. In this type of situation I think the question is really whether these guys will take advantage of investors. Say what you want about them, but I have not come across anybody who questions their character.
Background
Henry Goodrich founded Goodrich Oil Company in 1975. His son, Walter “Gil” Goodrich joined the company in 1980 as an exploration geologist and became President in 1989. The company went public by merging with Patrick Petroleum, an NYSE-listed company in 1995, and in doing so went from running finite-life drilling programs with separate investor bases to running one continuously operating portfolio with one shareholder base. Gil became CEO and Henry became chairman. Gil brought in Rob Turnham as COO the same year. They knew each other from school and Rob had helped raise money for them along the way. Gil and Rob still run the company.
Henry semi-retired in 2003, handing the chairman title to Gil and becoming chairman-emeritus. He passed away in 2014. I visited their offices a few years ago. They were nice. Maybe too nice for a small cap E&P, but not uncommonly so. What I remember most about the visit was a painting of Henry that was on one of the walls. At the time I thought it was a bit over the top but I didn’t know much about the company back then. As I have revisited the stock with the benefit of hindsight I think the significance of the painting is that legacy is important to them. I think that probably means something for the stock in the context of a situation where the son took over the father’s business and years later it ended up in Chapter 11 where the shareholders got nothing. They raised a lot of money over the years. Friends and members of the local community probably invested with them and took a zero. Now Gil is 59 and Rob is 60. They have one last shot at redemption after the reorganization. The company’s assets are the best they have ever had. The stock is crazy cheap and they have the opportunity to do right by all the people who have supported them through this process, whether it’s investors who backed them in spite of the downturn or employees who have stayed when maybe they could have gone elsewhere. The question they face is how do they want the movie to end?
The company has always had a focus on Gulf Coast properties as far as I can tell. At one point around the turn of the unconventional revolution they had a 40k net acre position in the Cotton Valley in Louisiana where they were drilling vertical wells. Then they went horizontal. Around 2007/08 they started leasing up acreage to the west in the Haynesville and tried the horizontal concept there too. It worked, and suddenly they had a tiger by the tail.
In order to accelerate their exploitation of the play they did a ~$90 million equity offering and a JV with Chesapeake. The purpose of the JV was twofold: it brought money in the door (they got paid $172.6 million for 10,250 net acres, or $16.8k/acre) and CHK helped bring GDP up the learning curve by bringing technical knowledge to the table; they had been an early mover in the play.
Goodrich’s Haynesville production ramped hard, from almost nothing in 2008 to 55% of total company production in 2011. The problem was all the other gas producers in the Haynesville and Marcellus were doing the same thing. Gas prices had gone from $2/mcf in the late 1990s to an average of $8.85/mcf in 2008 just as the unconventional revolution kicked into gear. The price signal was strong and the industry had just unlocked a massive resource, so E&Ps put the bit between their teeth and ran. It’s what they do.
As it became clear that dry gas drilling economics were in jeopardy due to the supply wave, Goodrich looked to diversify into liquids-focused plays like the Eagle Ford in South Texas and the Tuscaloosa Marine Shale (TMS) in eastern Louisiana. They and the industry left the Haynesville for dead. As far as gas plays go it just couldn’t compete against the Marcellus where the rock was better, the wells were cheaper due in part to the landing zones being at shallower depths, and many of the wells got a revenue boost from the presence of more valuable liquids in the production stream. The scale was also bigger. The Haynesville’s rig count peaked at 160 in early 2011, and production peaked shortly after in November 2011 at 10.6 bcf/d, or >15% of total U.S. supply, before going into structural decline. It had become the biggest gas basin by a wide margin, but only for three years. Its moment in the sun was brief.
From 2011 through 2014 Goodrich spent nearly $1 billion, or 80% of their cumulative capex, trying to ramp in the TMS and Eagle Ford. It was an enormous bet for a company of their size. The problem was their Eagle Ford acreage was not Tier 1, and well costs in the TMS were not consistent. They frequently encountered problems during construction that sent their costs over budget.
Since the TMS was a frontier science project, Goodrich thought they would be a fast follower behind Encana and Devon in the TMS, but those companies eventually retreated before they cracked the code and refocused on assets in their portfolio that had more consistent economics. It might be fair to say a company of GDP’s size just didn’t have the technical resources to crack the code in a play with that level of complexity all by themselves, and yet they compounded the problem by betting the ranch anyway. They tried to bring in outside capital to shoulder the burden in the TMS similar to what they did with CHK in the Haynesville but it didn’t work out.
When the downturn hit Goodrich was a sitting duck. They hadn’t even been getting good results when times were good; recycle ratios were barely 1x and debt-adjusted production per share had fallen 43% from the cycle’s trough in 2009 to the peak in 2014 (you read that correctly - it fell 43% from trough to peak). And, they had been massively outspending cash flow. I have studied their financials going back to the IPO in 1995 and they literally outspent cash flow every year since then except the first two: 1995 and 1996.
I don’t know the specific reasons why Goodrich was always so aggressive with their spending, but it is consistent with the general mindset that many small E&Ps seem to have - find a play, ramp activity as aggressively as possible, and hope the asset makes your company an attractive target for a large acquirer who needs to replenish reserves. If it doesn’t work out, try again. Some percentage of plays will be duds, so the faster you throw things at the wall the sooner you will find one that sticks and becomes your lottery ticket. All that activity requires external capital. Not all of it can be raised in the form of equity because some percentage of investors who are willing to back you want a promise of repayment, so you take what you can get. If you cycle through enough plays trying and failing to get to the promised land eventually you wind up with a balance sheet that is unsustainable.
Debt/EBITDA was >4x in 2014 and that was when oil was still at $100/bbl and gas was at $4/mcf. As you can imagine, their leverage metrics expanded by more than just a bit when commodity prices collapsed. They did a $50 million secondary offering in March 2015 but that was just delaying the inevitable. They filed for Chapter 11 bankruptcy protection on April 15, 2016.
Then a nice thing happened while they were reorganizing. Other producers figured out how to make much better wells in the Haynesville, suddenly making GDP’s Haynesville assets highly competitive. Assets have second and third lives in the energy business all the time. Sometimes you just get lucky.
Marcellus basis differentials had blown out to over $1/mmbtu as the basin’s production growth overwhelmed local takeaway capacity. It had became a victim of its own success. 
Source: Howard Weil
Meanwhile, Haynesville differentials remained narrow in the $0.15-0.20/mmbtu range by virtue of its close proximity to Henry Hub in Erath, LA. It’s only 200 miles away, and 20% of domestic natural gas consumption is centered in Texas and Louisiana. Moreover, local demand growth forecasts are very robust. Most of the 10 bcf/d of LNG export capacity coming online over the next few years is located in those two states. Industrial demand from new chemical plants is also increasing.
Source: Tellurian presentation, Feb-2018
The expectation that advantageous basis differentials would persist in the Haynesville motivated some operators to revisit the play. In the five years since the basin went into structural decline, the E&P industry made significant progress making better wells in other basins. When leading edge completion techniques were applied to new Haynesville wells the productivity was suddenly much higher. F&D costs fell from $1.50-2.00/mcfe to $1.00/mcfe or less. That kind of cost improvement is a huge deal when the price of your product is $3/mcf. Lower F&D costs coupled with superior basis differential advantages allowed the basin to compete for capital again. As a result, the rig count in the basin has actually risen back to the point where it is roughly equal with the Marcellus, which is remarkable.

Source: Baker Hughes
Goodrich emerged from Chapter 11 on October 12, 2016. They did a $25 million private placement for 2.3 million shares at $11/sh to jump start their Haynesville drilling program and return to growth.
Source: SEC filings
The Company as it Stands Today
-
Haynesville: They have 38,600 gross (18,900 net) acres in the core of the Haynesville. This asset accounts for >90% of their production and 100% of their growth. The volumes are virtually 100% dry gas. The acreage is held by production. Proved reserves at YE2017 were 411.3 Bcfe (12% proved developed) and accounted for 96% of the company’s total. CHK operates a chunk of the acreage. The JV agreement limits gross quarterly capex in the acreage to $50 million, which is still high enough to potentially overwhelm GDP’s ability to participate in all the wells in light of their $85-95 million capex budget for 2018, but they have never come anywhere close to $50 million in a quarter.
GDP has 100 net locations which equates to 11.5 years of inventory at the 2018 pace of 8.7 net wells.
-
50 net locations have 10,000’ laterals. EURs are 25 Bcfe (2.5 bcfe/1k’), well costs are $12.4 million ($1,240/lat foot) and well-level F&D costs are $0.68/mcfe after 27% royalties. The royalty rate is so high because they agreed to a higher rate with the minerals owner in exchange for no up front payments when they first entered theplay. They generate well-level recycle ratios of 3.1x at the strip.
-
25 net locations have 7,500’ laterals. EURs are 18.75 Bcfe (2.5 bcfe/1k’), well costs are $10.2 million ($1,360/lat foot) and well-level F&D costs are $0.75/mcfe after 27% royalties. Well-level recycle ratios are 2.8x at the strip.
-
25 net locations have 4,600’ laterals. EURs are 11.5 Bcfe (2.5 bcfe/1k’), well costs are $8.3 million ($1,800/lat foot) and well-level F&D costs are $0.99/mcfe after 27% royalties. Well-level recycle ratios are 2.1x at the strip.
Those numbers are very similar to the well-level economics asserted by Chesapeake and Comstock.
Refracs are a potential opportunity the company has not pursued yet. Some Haynesville operators are generating nice economics by going into legacy wellbores and refracking with the benefit of knowledge gained since the original completion. Goodrich has 91 producing Haynesville wells.
The state of Louisiana’s severance tax rate on natural gas production is $0.11/mcf but there is an abatement for the first two years or payout, whichever comes first. Those savings equate to 4% of revenue during the abatement period assuming a wellhead price of $2.75/mcf.
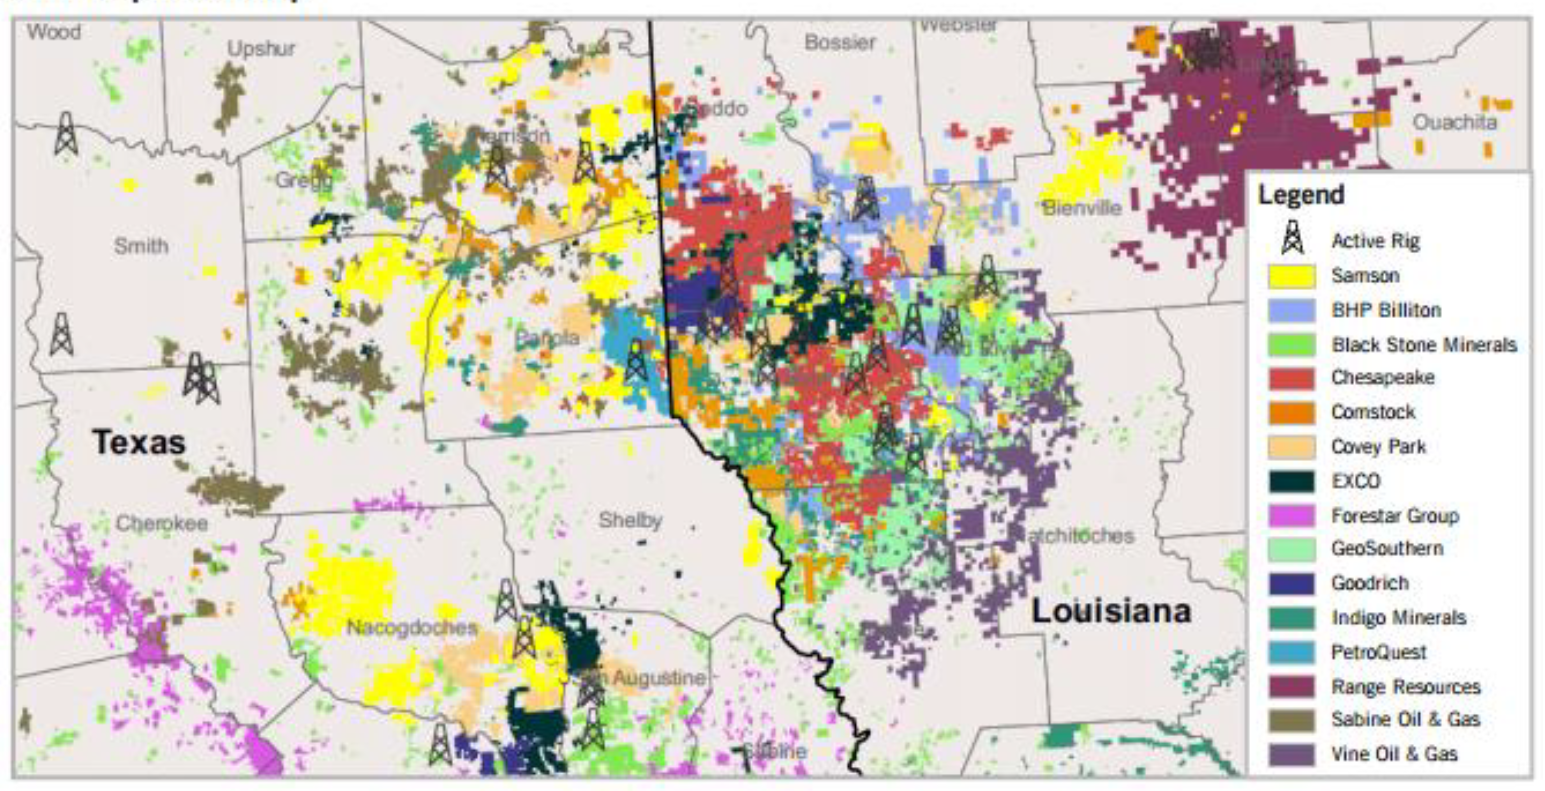
The map below is a bit fuzzy but it is the best one I have found in terms of being able to see the other operators in the play. One thing that stands out is just how fragmented the acreage is amongst a variety of Tier 2 and private E&Ps. There are a lot of companies that are not household names with investors. The basin never really consolidated in part because the elevated gathering rates embedded in legacy midstream contracts. There was already a lot of infrastructure in the region before the Haynesville rose to prominence but it was not sufficient to handle the enormous pressures and volumes that were anticipated as drilling ramped up. New pipes were needed, and operators rushed to sign take or pay agreements at top dollar in order to ensure anticipated takeaway capacity. When the basin was eventually marginalized those agreements went from being assets to liabilities. The agreements are finally being dealt with as operators have restructured. Details are scarce so it’s hard to analyze the issue with much granularity, or perhaps I just haven’t taken the time to do the work.
Source: Guggenheim, Apr-18-2017
-
Angelina River Trend: They had 12,700 gross (7,500 net) acres in this play as of YE2017. It’s prospective for the Haynesville and Bossier shales. Some companies have been drilling nice wells there but GDP does not have any material production or reserves in the play. Subsequent to year-end they sold 4,300 net acres to BP for $23 million ($5,350/acre or $2/sh) without giving up any EBITDA. It was basically found money. Now they have 3,200 net acres.
The acreage is pretty good. BP claims 40% full cycle returns at $3/mcf Henry Hub. They went from almost no position in the play in 2015 to enough acreage to support six rigs currently. In the last 18 months they went from almost no production to 210 mmcfe/d and expect to grow to 600-900 mmcfe/d in the next five years. (This is great for Black Stone Minerals). -
Tuscaloosa Marine Shale: They have 87,600 gross (64,900 net) acres in the TMS. 40,000 net acres are held by production. The production is oily so it gives the company’s PDPs a little bit of a revenue uplift over a pure gas stream, but it is going away because there is no activity on the acreage. Production declined 36% in 2017 and will continue to fall. The company doesn’t think it warrants capital unless oil prices rise into the $70s.
-
Eagle Ford: They have 32,400 gross (14,100 net) acres in Frio County, TX. It’s not too far from decent acreage that Cabot sold, but GDP already sold off the developed Eagle Ford acreage they had. The stuff that is left does not have any producing wells on it so a buyer would be taking some geologic risk. I don’t model any value for it anyway.
-
Corporate: They reduced headcount from 105 at YE2014 to 44 at YE2017. Nevertheless, G&A still looked incredibly high at $1.37/mcfe in 2017. You have to keep in mind the company was unable to invest enough money in their assets to mitigate production declines and it fell by more than 50% over the last few years.
Cash G&A is running at $12 million per year. The 8.7 guided net completions in 2018 will add enough production to achieve significant fixed cost leverage. I model G&A falling to $0.37/mcfe in 2018 and to $0.25/mcfe in 2020. Tier 1 behemoths like Antero, Cabot and EQT are at or below $0.15/mcfe. CNX Resources, Range and Southwestern are just over $0.20/mcfe. So, GDP will become much more competitive on this cost metric in the not too distant future.
The company believes they have enough staff in place to achieve their growth plans for several years, so they are unlikely to see G&A dollars increase in absolute terms.
-
Taxes: They will not be a cash taxpayer for the foreseeable future. They have a federal NOL of $129 million and $260 million of intangible drilling cost carryforwards. Importantly, those IDCs are not subject to an annual limitation should GDP be acquired.
-
Capital structure: I model $22.7 million of net debt pro forma the Angelina River Trend sale to BP. They already had $26 million cash at YE2017, so that’s $48.7 million of cash in total.
Total debt principal as reported was $63.7 million. They had $16.7 million drawn on their $40 million revolver and $47 million of convertible second lien notes left over from Chapter 11 with a 13.5% PIK coupon. However, they intend to call the notes this fall. The make whole call provision along with the accrued PIK interest translates to a total payoff of $55 million, so they effectively have $71.7 million of total debt when combined with the $16.7 million revolver balance. I model them replacing those debt pieces with a $75 million new term loan at 8.5% in the fall. (That is just a guess.)
I model 11.8 million adjusted basic shares outstanding. There were 10.8 million basic shares out as of December 31, along with 1.07 million costless warrants. There are another 1.4 million warrants outstanding with a strike price of $17.01/sh. I take those into account in my valuation analysis if the enterprise value rises above $224 million, which is the threshold level that results in an equity value of $17.01.
In addition, there are 1.6 million shares of restricted stock that have been granted but they are not vested yet and it will take several years for vesting to happen.
-
Hedges: I model 36% and 12% of their 2018/19 production hedged. 30.6 mmbtu/d of gas is hedged for 2018 at $3.02/mmbtu and 14.0 mmbtu/d of gas is hedged for 2019 at $3.03/mmbtu.
Valuation
-
PDPs only ($11/sh): Production is currently running 60 mmcfe/d. When I do a PDP blowdown using their guided differentials, LOE, transportation costs and severance tax rates, along with a 10% discount rate, I get an NPV of $153 million (which implies a multiple of $2,550 per flowing mcfe).
That happens to be exactly equal to the current enterprise value of $153 million, which is based on 11.8 adjusted basic shares out at $11/sh, $71.7 million of adjusted debt, $26 million cash at YE2017 and $23 million from the subsequent acreage sale to BP.
I can’t think of another E&P with decent rock and a clean balance sheet where the current share price doesn’t embed any value for the PUDs.
-
Development model ($22/sh):
-
This is based on a long-term price deck of $2.75/mcf Henry Hub and $55/bbl WTI held flat, which approximates the strip. It also bakes in guided gas differentials of $0.12-0.15/mcfe and guided oil differentials of $2.00-2.25/bbl.
-
I assume they are limited to spending within cash flow, and all excess free cash flow is swept first to debt reduction until it’s all gone, and then it all flows to equity. I assume $12 million of cash G&A, 21% corporate taxes, and a $129 million federal NOL (I frankly don’t know how to work the IDCs into the model, so leaving them out is a source of convservatism).
-
I assume their EURs are just 2.25 bcfe/1k’ rather than the 2.5 bcfe/1k’ shown in the presentations. I assume their completions in every year are split evenly between the 10,000’, 7,500’ and 4,600’ locations. This is probably conservative because they are not drilling many if any of the less productive 4,600’ locations right now while they try to block up that acreage in order to create longer laterals. Their average lateral length in 2018 will be approximately 9,000’.
-
I assume spud to spud cycle times of 28/25/23 days for those locations. I also don’t model any efficiency gains.
-
Normally I add a gross up factor to well-level drilling & completion costs for things like infrastructure, seismic, capitalized overheads, etc. but in this case I do not because they already have $150k for infrastructure baked into well cost guidance and so many of the drilling spacing units already have at least one well on them so additional infrastructure needs are minimal.
-
I assume they raise $75 million of new debt at a 8.5% coupon in late 2018
-
I roll the hedge gains/losses into operating cash flow, which in turn increases/reduces the amount of money available for capex
-
I use 13.2 million diluted shares out (rather than 11.8 million adjusted basic shares) because the resulting asset value of $267 million is greater than the $224 million EV threshold of the $17.01/sh warrants. I add $23.8 million cash proceeds to the EV from the exercise of the warrants.
-
I use a 10% discount rate.
-
This methodology gives them no credit for the Angelina River Trend acreage or Eagle Ford acreage. In other words, it only takes into account the identified locations they include in their drilling inventory.
-
Acquisition model ($30/sh): This methodology is pretty simplistic - strip out all the G&A from the development model and see how much the NAV increases. I admit it’s not very scientific but the reality is any acquirer would be able to eliminate the G&A burden and use the savings to accelerate development to bring forward production revenues from new wells.
For a Tier 1 gassy E&P with G&A already down in the $0.15 - 0.20/mcfe range this would not be such an important exercise. However, it’s very important in terms of valuing GDP however because they are just starting to resume production growth off a low base and they have not achieved a competitive level of SG&A fixed cost leverage yet. The uplift in value is significant as you can see, going from $22/sh to $30/sh all else equal.
-
A&D transaction comps ($15-25/sh):
-
Covey Park/EP Energy ($18/sh): EP Energy sold Haynesville assets to a Dallas-based PE firm named Covey Park in Mar-2016. The total transaction value was $420 million. Valuing the PDPs at $2,500/flowing on 113 mmcfe/d of run rate production works out to $282.5 million, implying a residual value of $137.5 million for the acreage. The net acreage was 34,167, implying ~$4,000/acre.
GDP’s run rate production is 60 mmcfe/d. The PDPs are worth $150 million assuming $2,500/flowing. The 22,100 net acres they have in the Haynesville core and Angelina River Trend would be worth $88.4 million assuming $4,000/acre. (This is lower than the $5,350/acre valuation they got in the recent sale to BP). Total enterprise value would be $238.4 million. Since the EV of $238.4 million is above the $224 million threshold necessary to put the 1.4 million warrants with a strike price of $17.01/sh in the money, I add $23.8 million cash proceeds from exercise to the EV before deducting net debt of $22.7 million to get an equity value of $239.5 million, and I use a diluted share count of 13.2 million (rather than 11.8 million basic shares pro forma the conversion of the remaining costless warrants). Value per share is then $18.
Just to be clear, the sale by EP Energy virtually bottom ticked the market and that still gets you to 70% upside over GDP’s current share price.
-
Chesapeake sale #1 ($19.50/sh): Chesapeake sold a Haynesville package in Dec-2016 for $450 million. The assets included 30 mmcfe/d of flowing production and 78,000 net acres, of which they considered 40,000 to be core. If you assume the PDPs were worth $2,500/flowing, or $75 million, the residual $375 million for the acreage works out to ~$4,800/acre.
That figure implies a value of $106 million for GDP’s 22,100 net acres. The EV is $256 million when you add the $150 million for the PDPs. Since it’s above the $224 million EV threshold of the $17.01/sh warrants I add $23.8 million cash proceeds from the exercise before deducting net debt of $22.7 million to get an equity value of $257 million. Dividing over 13.2 million shares out gets me to $19.50/sh.
-
Covey Park/Chesapeake sale #2 ($25/sh): Covey Park was back for a second helping just nine months after the EP Energy deal. They paid $465 million to buy 50 mmcfe/d of flowing production and 41,500 net acres from CHK. It was CHK’s second Haynesville asset sale of the month. Assuming the PDPs were worth $2,500/flowing, the implied acreage value was ~$8,200/acre. Plugging that figure into my GDP sum of the parts model using the same framework as above, I get a value of $25/sh.
-
Tellurian/Rock Cliff ($15.00-24.50/sh): Charif Souki is back! And this time he’s not just building another boring LNG export facility with take or pay contracts. No, he wants to build an audaciously big 4 bcf/d export facility (5% of current demand!) and vertically integrate upstream with 15 Tcf of Haynesville gas resource.
In Sep-2017 they bought a company called Rockcliff Energy with 4 mmcfe/d of production, 9,200 net acres and 138 undeveloped locations. Assuming $2,500/flowing, the PUDs are worth ~$7,800/acre or $520k per location.
The implied value of $7,800/acre would put GDP at $24.50/sh using the same framework with the warrants.
The implied value of $520k/location on GDP’s 100 net locations would put the stock at $15/sh. The PUDs would be worth $52 million on top of the $150 million PDP value, for a total EV of $202 million. Since that is less than the $224 million EV “strike price” of the $17.01/sh warrants I assume no dilution and leave the basic adjusted share count at 11.8 million. Total value of $202 million less $22.7 million of net debt results in an equity value of $179 million. Divided over 11.8 million shares gets me to $15/sh.
GDP’s undeveloped locations are better than TELL’s, though, so the $15/sh valuation is likely conservative. The type curve assumptions TELL provided imply a well-level recycle ratio of 2.4x at $3/mcf Henry Hub vs. 3.1x/2.8x/2.1x for GDP’s 50/25/25 locations with 10.0k’/7.5k’/4.6k’ laterals.
The 100 net locations imply 1.8 Tcfe of gross resource. It’s barely 10% of what TELL wants to eventually acquire, but TELL may have to chip away at their 15 Tcfe goal because there is only one target big enough to meet the target in one fell swoop. CHK claimed 18.9 Tcf in recoverable resource from their Haynesville acreage at their analyst day in Dec-2016.
The WSJ reports TELL is in talks to buy CHK’s Haynesville assets. The article highlighted that Jefferies thinks they’re worth $2 billion, but that seems awfully light. CHK’s Haynesville production was 930 mmcfe/d in Q4’17. A PDP valuation at $2,500/flowing works out to $2.3 billion and surely the PUDs are worth something. Perhaps CHK is willing to accept some earnouts or TELL equity on top of the PDP value as a kicker. I know CHK pays a higher rate on their gathering than GDP does ($0.50/mcfe vs. $0.25/mcfe) but I don’t know how much longer their commitments last.
There are a couple things that are unclear about TELL’s strategy. First, they have no operating assets currently, so no cash flows with which to support additional financing. The project is all on the come. Second, they have no ability to operate E&P assets. How they will do that is also unclear. Charik knows how to raise money so unless this project actually dies and somebody produces a body I will consider it to be alive.
-
Future PDP Liquidation ($16/sh in 2018, $28/sh in 2019, $36/sh in 2022): This is just a thought exercise but it is instructive. Let’s say the stock market refuses to ever recognize the value at GDP and the stock languishes at $11/sh. The company grows production as planned and eventually liquidates itself only for PDP value. Is there enough of a gap between price and future production value to offer an attractive return if a corporate raider shows up and dismantles the company?
Yes. Consensus estimates for 2018 production are 85.6 mmcfe/d. Valued at $2,500/flowing, the stock would be worth >$16/sh. The company expects to grow production 75% in 2019, implying 149.7 mmcfe/d. (I am modeling less than that, but I don’t let them spend outside cash flow except in Year 1, or 2018). The stock would then be worth $28/sh. Roll forward five years from now to 2022. I model production of 191.3 mmcfe/d. The stock would be worth $36/sh.
Source: Capital IQ, Mar-12-2018; GDP press release, Mar-12-2018
-
EV/Standardized Measure ($19.75/sh): Goodrich’s Standardized Measure at YE2017 was $260.3 million based on SEC pricing of $2.98/mcf and $51.34/bbl. Again, proved reserves are based on just 60 booked PUD locations out of 100 total net locations in inventory, so this is not necessarily a ceiling on the valuation.
What is the stock worth if you get just 1x the Standardized Measure?
The $260.3 million value is greater than the $224 million EV threshold necessary to put the $17.01/sh warrants in the money so I take out $22.7 million of net debt and add $23.8 million of warrant proceeds to get an equity value of $261.4 million. Divided over 13.2 million adjusted diluted shares gets me to $19.75/sh.
The current EV of $153 million is just 59% of the Standardized Measure, even though GDP’s drilling inventory extends the visibility of the resource base beyond the proved reserves. There are all sorts of reasons you can come up with as to why the value suggested by that metric will never be realized, but you should consider that in GDP’s history as a publicly traded company going back to 1995 the lowest average multiple of EV/Standardized Measure they ever traded for any year was 0.75x, and their asset base and their balance sheet have never been as good as they are now.
Tier 2 E&Ps with comparable or worse asset bases and balance sheets than Goodrich are trading at far higher multiples today. No matter how you slice it a multiple of 0.59x is very depressed.
Source: SEC filings, Capital IQ
You have to go back to the dark days of the early 1990s to find a time when E&Ps traded at half their Standardized Measure. The game is very different in some ways now with the visibility and repeatability of unconventional resources beyond the reserves booked under the SEC’s five year rule. I pulled the graph shown below out of my personal wayback machine of old spreadsheets. I admit there are some flaws with it. For example, the APC numbers don’t adjust for their Western Gas midstream assets, although that wasn’t an issue until WES’s IPO in 2008. And, it’s large caps as opposed to small caps like GDP, but the large caps are generally the only E&Ps with uninterrupted time series that go back that far.
Source: SEC filings
Why the Stock is Mispriced
-
The most obvious explanation is GDP only trades $500k/d. It’s tough to buy in your PA, so how is a portfolio manager going to build a multi-million dollar position? If you’re running a $100 million portfolio and you want to make it a 2% position that’s $2 million. If you’re 20% of the volume it’ll take you 20 trading days, or nearly a month, to build the position, and then you better be sure you can own it for a while because you will not be able to get out quickly without totally destroying the stock. Apparently Sentinel participated in that private placement GDP did at $11/sh in 2016. I was told they subsequently wanted to get out when the stock was at $15 and their selling (along with a weak energy tape) pushed the stock back down to $11.
- The stock is not marginable at Interactive Brokers, Schwab or Morgan Stanley, and possibly other firms.
-
Also, Goodrich does not have enough cash flow to fund a capital budget that is big enough to keep two rigs and one frac crew working full time, which you usually need to do in order to maximize productivity. In my estimation it would take a budget of $300-400 million to do so with GDP’s inventory. With a 2018 budget of $85 95 million they are unlikely to be in that position any time soon. For now it seems to be a non-issue given the service capacity slack in the Haynesville. They are able to get Tier 1 service providers like Schlumberger. But, it could be a problem if activity in the basin heats up materially.
-
Franklin has been a continuous seller and I have no insight regarding when they will be finished selling. Some investors don’t want to deal with an overhang even though it gives them a chance to buy stock at a depressed price.
They still own 3.0 million shares after selling 1.8 million shares since last May. At the pace they have been selling I guess it could take them more than a year to fully exit, but I would think at some point somebody internally would say it’s crazy to keep selling stock at PDP value. Perhaps the recent block sale indicates a change of course.
-
You could take issue with the fact that Goodrich’s proved reserves were only 15% developed at YE2017. That is a very low ratio, but the geology in the Haynesville is well understood. This is not some frontier play where you don’t know what’s going to happen when you put a bit in the ground.
-
Their production has not kept up with the projections in their Chapter 11 Solicitation Package. If Goodrich had a large base of producing wells and was missing production estimates by this much right out of the gate it might be more concerning. (Same thing if this were a frontier play.) But, with such a small production base it’s very easy for just a couple of wells to move the needle if the drilling schedule gets moved around, particularly given how much of the EUR is produced in the first year for Haynesville wells (approximately 30% vs. just 20% for many other basins). The production growth outlook is highly robust so it’s not something I am worried about.

Source: SEC filings, GDP’s Ch. 11 Solicitation Package

Source: SEC filings, GDP press releases, Capital IQ
What else?
-
You could say, well, the company’s assets are gassy, and everybody knows the outlook for gas prices is terrible, so it should be cheap. Okay, but CRK is a gassy Haynesville comp and they are at 1.18x EV/Stan Meas while GDP is at 0.59x.
-
You could say fine, but CHK operates a bunch of GDP’s acreage, and everybody knows non-op assets are worth less than operated assets because you don’t control the pace of development in a way that maximizes your company-specific NAV. (GDP’s 2018 budget contemplates operating 85% of their net wells for the year.) Okay, but NOG is 100% non-op and they are at 1.34x EV/Stan Meas. Their balance sheet is also overleveraged.
-
You could say a-ha, but GDP has the taint of having been through Chapter 11 so they should be discounted because of their track record. So be it, but PVAC also went through Chapter 11 and they are at 1.37x.
-
Another explanation might be that GDP is outspending cash flow in order to get production ramped back up, and the market is currently discounting E&Ps that are outspending because “returns over growth” is the new mantra (and deservedly so for the broader industry). That is true, but every single one of those E&Ps in the Tier 2 comp group are outspending and yet they still trade at premiums to Standardized Measure.
-
What about their inventory life? It’s pretty low relative to the Tier 2 comp group, right? I would say 10 years of quality drilling inventory is the bare minimum investors want to see and they are just above that threshold. PVAC has slightly less and they are trading at 1.37x EV/Stan Meas vs. just 0.59x for GDP.

I’m also going to call BS on some of those other companies’ inventory claims. A lot of that stuff is just spreadsheet math as opposed to actual engineered locations, plus some of those location counts include a lot of marginal stuff because E&Ps want to show as much inventory depth as possible. GDP’s 100 net locations are legit and they could show even more if they included spreadsheet locations from the Angelina River Trend.
In addition, some of those inventories are from basins where the operators don’t have much experience. Would you rather bet on Contango cracking the code in the Delaware or Goodrich doing basic blocking and tackling in a basin where they have already been making wells for 10 years? Comstock learned a hard lesson about what it’s like for a small E&P without scale to tackle the Delaware where the drilling is difficult and there wasn’t much pre-existing infrastructure in place..
Finally, look at some of these balance sheets. Good grief. What good is having inventory as an equity holder if you won’t survive long enough for it to get drilled? On a probability-weighted basis I would suggest GDP’s inventory is as deep as anyone in this peer group.
Natural Gas Macro
I included a lot of material in my recent writeup on Range Resources (RRC) so I am not going to duplicate it all here. In summary I will just say that while I am not necessarily bullish on gas prices because there is an ocean of domestic supply that works at $3/mcf, I am very bullish on long-term demand pull, in particular because of our country’s ability to take market share in a rapidly growing LNG market.
Risks
The main risk I see is if there is some sort of macro event like a recession that causes commodity prices to collapse. If WTI fell to $40/bbl, I model $2.40/mcf Henry Hub as the threshold price that would mark the dividing line between positive equity value for GDP and a zero. At $2.45/mcf the equity is worth $7.50/sh so obviously they are highly leveraged to gas prices in the $2.40 - 2.45/mcf range.
However, if you took the G&A out the assets would be worth $10/sh at $2.40/mcf Henry Hub and have positive equity value all the way down to $1.70/mcf Henry Hub.
With all the demand coming down the pike it’s hard to see a total collapse in gas prices without a macro event.
Let’s call the downside $7.50/sh, or ~30%. Upside is easily high teens or 70-80%. Even $20/sh is easy to see with $30/sh being a blue sky case. We’ll call the upside $20 or 80%. That is a pretty solid level of upside relative to the amount of downside.
Parting Thought
A wise investor once told me you buy E&Ps for the balance sheet and sell for the income statement. I think Goodrich at $11/sh fits the bill.
I and/or others I advise hold a material investment in the issuer's securities.
Catalyst
Do cheap energy stocks even have catalysts any more?
| show sort by |