| 2018 | 2019 | ||||||
| Price: | 6.85 | EPS | 0.80 | 1.19 | |||
| Shares Out. (in M): | 16 | P/E | 0 | 0 | |||
| Market Cap (in $M): | 114 | P/FCF | 17.5 | 6.0 | |||
| Net Debt (in $M): | 74 | EBIT | 0 | 0 | |||
| TEV (in $M): | 188 | TEV/EBIT | 0 | 0 | |||
Sign up for free guest access to view investment idea with a 45 days delay.
- HOUSTON WIRE & CABLE CO HWCC 08/18/2019
- BETA
- Wadell Reed WDR 04/08/2020
- Lawson Products LAWS 04/12/2017
- VERTEX PHARMACEUTICALS INC VRTX 07/05/2021
- DARLING INGREDIENTS INC DAR 10/15/2014
- Manning & Napier Inc MN 07/27/2020
- World Health Alternatives WHAI 12/30/2004
- SoftBrands, Inc. SFBD.PK 10/10/2005
- eDreams ODIGEO BME:EDR 11/10/2017
- ENCORE WIRE CORP WIRE S 07/21/2022
- LUNA INNOVATIONS INC LUNA 08/11/2016
Description
Summary
Houston Wire & Cable Company (“HWCC”, “the Company”) is a provider of electrical and mechanical wire and cable, industrial fasteners, hardware, and related services to various industries, namely (1) oil & gas and (2) infrastructure. The equity has fallen ~36% over the past 3 years as declines in end market demand, metals deflation, and a strong USD have hurt results.
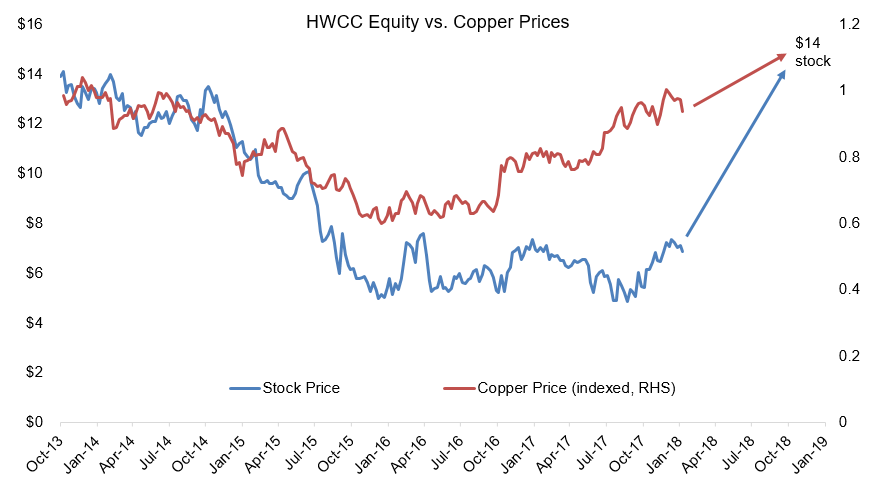
Management has taken advantage through the downturn by maintaining liquidity, completing an attractive tuck-in acquisition, and right-sizing the cost structure. Further, over the past ~12 months, macro, industry, and Company-specific fundamentals have turned favorably, yet shares of HWCC are up just 3% over the past year vs. market up >20%. Both revenues and gross margins have already turned the corner, yet sell-side estimates both in the near and intermediate-term remain far too low. Upward revisions ought to drive upside.
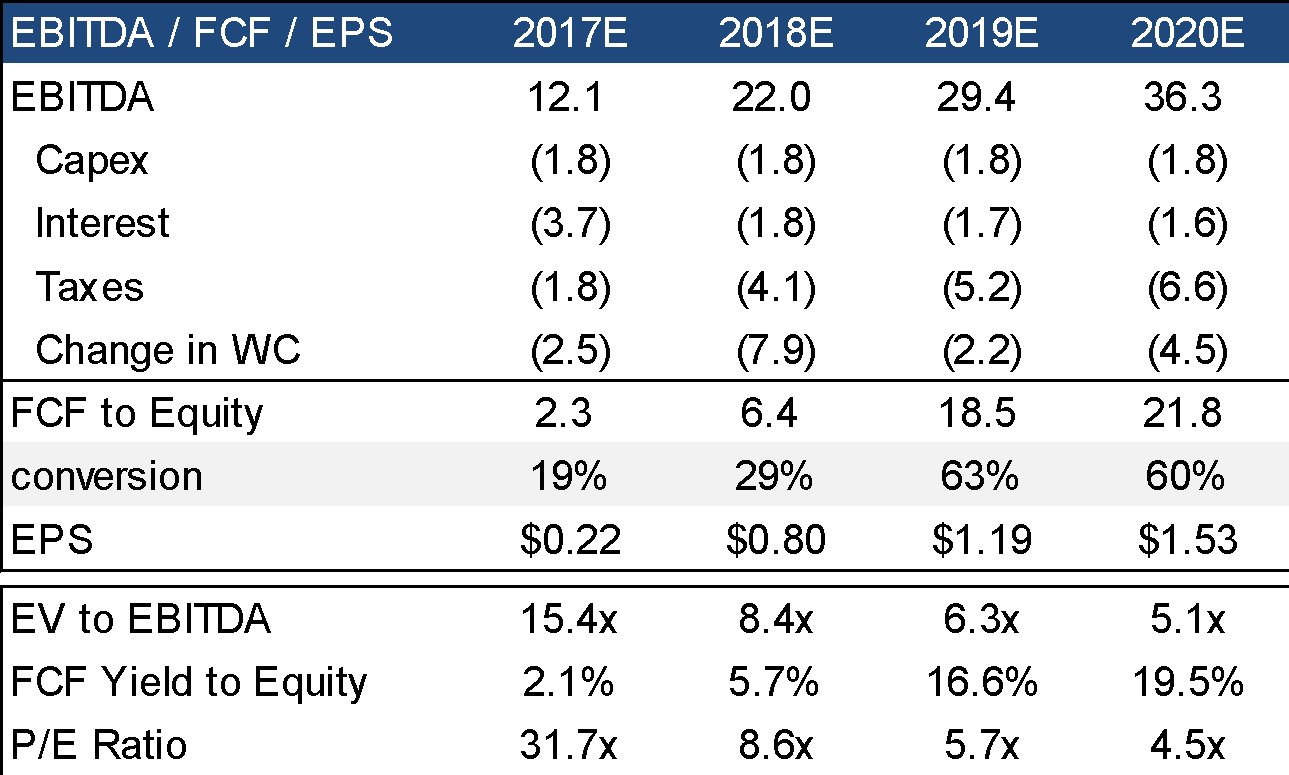
On 2019 estimates of $28mln in EBITDA and $18mln in FCF, the Company trades at 6.3x EBITDA and a ~17% yield to equity. An $11 target on the shares (>60% upside) implies 8.6x EBITDA or a 10.2% FCF yield. Note that assumptions driving these 2019 estimates remain below “mid-cycle levels” as measured by the 2006 to 2015 period; HWCC did double-digit EBITDA margins from 2006 to 2008 and the 2019 estimate implies just an 8.6% margin. This should also be easier to accomplish given contribution from the acquisition of Vertex which is doing 12% operating margins. 8.6% EBITDA is also relatively conservative; industrial distribution M&A is common, with transactions going off in the 9-15x EBITDA range (see valuation section). Most recently in December 2017, Prysmian (BIT:PRY) announced an agreement to acquire HWCC's larger peer General Cable (BGC) for $30 per share, or 0.7x NTM revenues and 11.5x 2018 consensus EBITDA. There are likely multiple suitors for Houston Wire, but management is likely holding out for the stock to reach double digits before considering a sale.
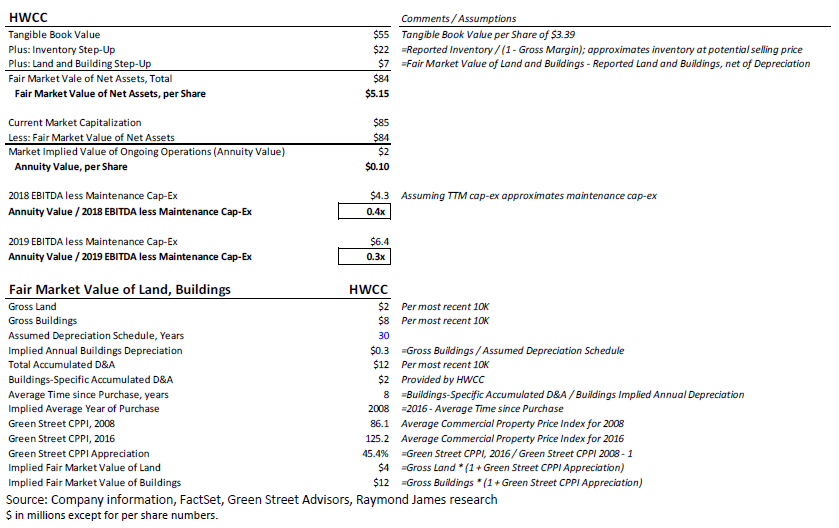
Shares trade at 2.2x tangible book value, but in a mark-to-market scenario, shares ought to hold ~25% downside to the hard value of the assets. i.e. relatively standard and liquid general-purpose warehouses. In November 2017, Raymond James ran an NAV analysis and placed the “fair market value” of the net assets at $5.15 per share. While the Company can’t simultaneously sell the assets and run the business, it does provide downside protection. The Company could also do sale leasebacks if leverage becomes an issue.
Company Overview
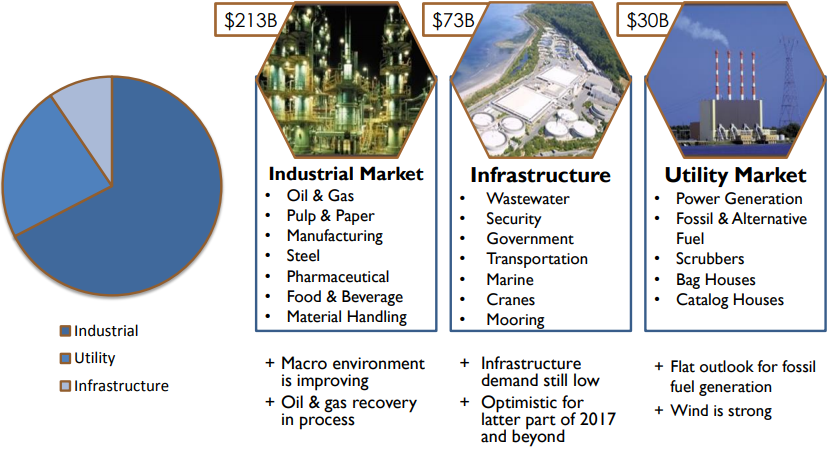
Houston Wire & Cable is a provider of electrical and mechanical wire and cable, industrial fasteners, hardware, and related services. The Company services both distributors and direct to end users, targeting industrial and utility markets in the continental US. Products are used in repair and replacement work (MRO) and related projects, large-scale projects in utility, industrial, and infrastructure, and a diverse range of industrial applications (communications, energy, marine, mining, etc.). While within the industrial end-market, oil and gas-related revenues consists of about one-third of the business, per management. The Company’s breakdown of end market exposure and TAM’s are shown below.
The Company providers value to customers most notably through value-added services and best in class delivery. For “mega-projects,” initial buys are made in bulk directly from the manufacturers, eliminating the need for a distributor. However, HWCC's product most often comes towards the end of the construction process rather than a bulk solution. The Company also offers services such as complimentary custom cutting, cable coiling, custom slings and harnesses, paralleling, bundling, and striping. These services are at no extra cost to the customer, yet provide tremendous value; both distributors and end users would prefer to avoid doing these things themselves, which results in scraps in the warehouse or on the job site. The dynamic can be understood by management’s unofficial tag line “we buy by the mile and sell by the foot.”
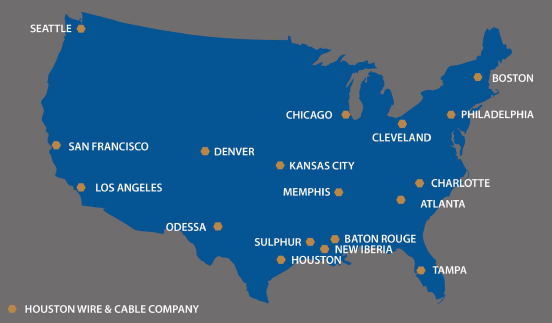
The Company also provides one-day shipping to 95% of the US and touts a 99% on-time order rate with 99% accuracy. This is a just-in-time solution with firm pricing, providing stability to customers’ businesses. The Company is partnered with 3 different 3PLs and holds 22 locations nationwide with a total 1.0mln sqft of distribution space. Due to the value-added services and a strong reputation for reliability through its network, the Company has carved a nice niche for itself in the industry. The Company holds both an inside sales force in regional offices and a field sales force positioned geographically.
Acquisitions
The Company purchased Southwest Wire & Rope from Teleflex Incorporated (TFX) in June 2010 for $50mln. Southwest was a supplier of industrial wire ropes, aircraft cables, and related hardware products. Additionally, the company provided material handling and lift products. The business did revenues of $80mln in 2009, while producing negative CFO of $10mln (acquired at 0.6x revenues).
The Company purchased privately-owned Vertex in October 2016 for $32.3mln. Vertex is one of the nation’s oldest fastener distributors (back to 1882). The business is similar to Houston Wire in that it has scale, is known for its same-day shipping, and the customer base is well-established distributors where Vertex plays the role of filling niche non-core items. Notably only 10% of the business is levered to oil & gas, with the primary end markets being water and wastewater. Vertex did $30mln in revenues in 2016, and based on management commentary of 38% gross margins and 12% EBIT margins (negligible D&A), the company was purchased for 9.0x EBIT. Additionally, the business came with $19.0mln of accounts receivable and inventory, which management can likely extract a few million in working capital from, bringing the effective purchase price lower. Management noted the purchase was accretive in year 1, and the margin profile is better than HWCC’s current metrics, which ought to aid in driving margin expansion in 2018 through 2020.
As a result of the Vertex acquisition in October 2016, management began issuing both inorganic and organic growth figures for Q4 2016 through present. Note that total year over year growth has been strong, but that even excluding Vertex, organic growth has been robust. In Q3 2017, both volumes and pricing came through to accelerate organic revenues +12.6% year over year. This flowed through to generate $2.6mln of EBITDA, a 3.2% margin.
Investment Thesis
Though cyclical, HWCC is a sound business whose fundamentals have turned.
With respect to revenues, end markets are industrial in nature, and dependent on overall non-residential construction spending / capex. Management estimates that 1/3 of revenues are tied to the oil & gas industry in the US. Thus, as the price of oil fell in 2014 & 2015, US drillers cut off capex and rig counts fell. Although unlikely that the US recovers to the previous 1,700 level, rig counts are now off the lows, up to 907 (Nov. 2017) from 568 in 2016. Drillers are spending again, no longer requiring $80 oil to be profitable.
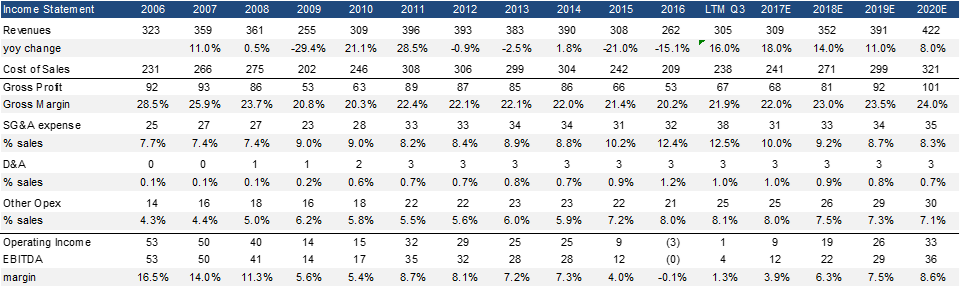
The Company sells copper wire. As the price of copper increases, the Company passes this cost along to customers, hence increasing sales without a commensurate increase in the cost structure, leading to margin expansion. Historically, the Company posted gross margins up to 28.5% in 2006, though this has fallen to 20.2% in 2016. The evidence would show that 2016 was a bottom; in the LTM ended 9/30/17, GM was 21.9% as copper prices recovered.
Furthermore, during the downturn, management made prudent decisions such that the business is stronger coming out the other side. Per the Q4 2016 call,
So finally, finally, we have some wind filling our sails, and we're ready for it. We have the inventory. We've prepared our business over the past couple of quarters to do even better when the market recovers. We've invested in people. We've invested in new products. We haven't cut inventory. We've improved our digital platform. We've added engineering services in heavy lift. We've acquired a company. We've paid down debt. We've returned capital to shareholders. We've worked really, really hard over these past couple of years to do what we felt was the right thing to do given the present operating environment. And now finally we're starting to see some light at the tunnel.
The sell-side hasn’t reflected upturn in 2018 to 2020 numbers; beats should drive upside.
Management noted in the Q4 2016 call that the business could get back to a 5% EBIT margin, should sales increase 10 to 15%.
“in that 5% range. I think that’s doable … Again, we have a fixed-cost structure. We can take more capacity through the system. If our sales increase 10% or 15% … I’m saying the ratio of operating income to sales will be about 5%, if everything pans out.”
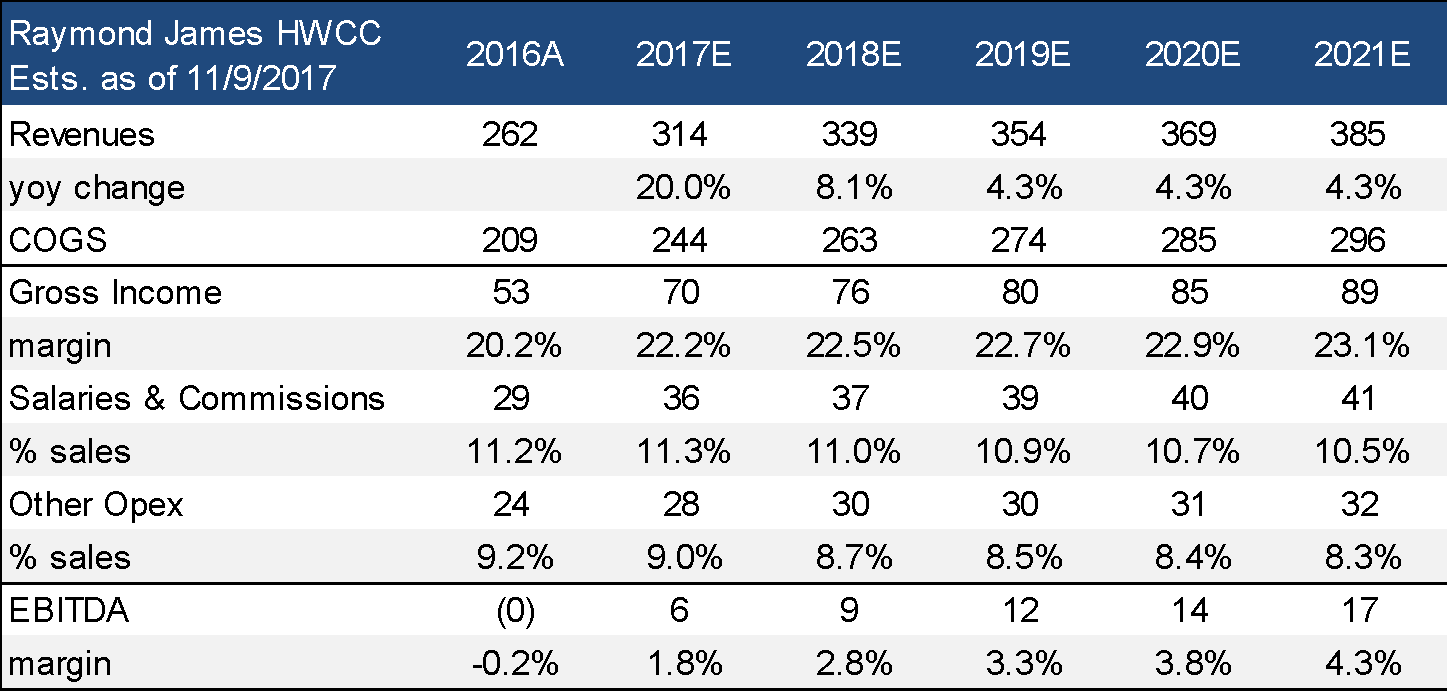
Since then, revenues are due to be up ~20% for 2017, with a $30mln contribution from Vertex at a 38% gross margin and 12% EBITDA margin (which should move 150-200bps higher with the consolidation of facilities). Nevertheless, the sell-side continues to model just 2.8%, 3.3%, and 3.8% margins for 2018, 2019, and 2020.
Even in Q3 2017, the sell-side has been hesitant to catch up with underlying performance,
“3Q organic sales growth was “12.6% y/y, comfortably above our +6.8% y/y model.”
“The adjusted EPS beat was all above the line, with a $0.03 benefit from better gross margin than modeled, a $0.02 benefit from better SG&A as a percentage of sales, and a $0.01 benefit from lower D&A than modeled.”
“We raise out 4Q project sales to +1% y/y from -8% prior.”
As commodities continue to move in the Company’s favor and management tone improves, analysts ought to increase estimates. Notably however, even if copper prices and industrial production were to remain subdued, the next 2 quarters ought to still exceed expectations. As noted, the Company comes in at the tail end of projects; thus, performance trails common production indices and rig counts by ~a quarter. Similarly, due to average cost inventory pricing, gross margins expand after 4-6 months of higher copper pricing. Given a strong past 3 months in copper, the Company should see gross margins improved markedly in Q4 2017 and Q1 2018. Historical financials and our estimates are shown in the table below. As shown, the Company ought to outpace both management’s Q4 commentary and sell-side estimates given better than expected performance since that initial commentary.
Management has been forthright in communicating the market environment; note the tone changes through the last several quarters:
Q3 2016:
As we move into the final quarter of 2016, and -- our market outlook remains cautious. Although our third quarter 8% metals-adjusted MRO sales growth and the higher land-based rotary rig count is encouraging, we are yet to witness any increase in industrial products or material improvement in market demand from oil and gas rich geographies.
Moving forward, it's certainly possible that we will see a little bit more pressure depending on what the market does…
Q4 2016:
“The project business has been slow to form. We’re seeing some build in Q1. There’s certainly no doubt about that. I wouldn’t describe it though as anything to get excited about yet. I’d like to tell you otherwise, but that wouldn’t be fair.”
“We’re not out of the woods, and we need to keep that in mind. Things are improving, though.”
Q1 2017:
So the tertiary work, to answer your question, latter part of this year, next year, I would expect more traction there.
With respect to midstream work, we're beginning to experience that now. And I'm hopeful and have reason to believe that it will remain steady and slowly build.
Q2 2017:
Because of our pipeline data, because of voice of customer, because of the macros, because of the aging of the megaprojects on the Gulf Coast, later-cycle work that potentially is available to us now, all those variables indicate to me that we've experienced a soft landing and should grow from here.
Q3 2017:
Oil and gas, good. I haven't seen any change in the macros that would change that market performance apart from seasonality.
we've seen a nice lift in broad industrial markets, as you could have observed. Infrastructure did quite well last quarter. Heavy industrial with steel, heavy industrial manufacturing, pulp and paper, plant upgrades, all quite good. With respect to pricing, we did have a good pricing quarter. And metals was a tailwind there, but the story is far from all metals.
Along with external indices such as industrial production, indications are that end-markets have bottomed and that the Company should continue to benefit going forward.

As an additional read-through, Anixter (AXE) reported solid Q4 results on January 30, citing strong growth in electrical products and improving industrial end markets. The Electrical & Electronic Solutions and the Utility Power Solutions segments were up 14.7% and 9.7%, respectively.
Management is likely looking for an exit / retirement. Sale would be done above $10 per share:
CEO Jim Pokluda III is 53 and CFO Nic Graham is 65. Jim has been CEO since January 2012, previously serving as President for the 7 months prior and serving as President of Sales and Marketing from 2007 to 2011. Jim has been with the Company for 31 years and also held roles in management merchandising, supply chain and M&A. CFO Nic Graham has been in the role since 1997, previously serving as the Company’s controller. He is a CPA and has been with the Company for 33 years.
Activist David Nierenberg filed a 13D in September 2017, bringing his stake to 8.3%. We believe that he did so to bring light to the Company, and that he will most likely pressure the Company for a sale when the time is right.
Conversations indicate that there is interest in the Company, but that management is unwilling to entertain offers with the stock trading in the mid-single-digits near cyclical lows. Should the Company return to $1.00 in EPS by 2019 (we estimate $1.19), this is likely a $12 stock. 9.0x EBITDA implies $11.60 per share. Given a 2 to 3-year timeline, this is a worthwhile IRR.
Valuation – Base case assumptions
Capital Structure
The Company finances working capital on the revolver and opts not to hold cash. Thus, there is typically $30-40mln on the revolver. Due to the Vertex acquisition, the Company took on an additional $33.8mln of debt under its $100mln revolver expiring September 2020. Under certain circumstances, the Company can borrow up to $150mln. The revolver holds a rate of L+100-150; as of Q3 2017, the effective run-rate interest rate was 2.92%, or $2.2mln of annual interest expense. The revolver has a fixed charge covenant, while the Company can issue dividends, repurchase stock, and make acquisitions at will. The fixed charge covenant is lenient; EBITDA less taxes and capex must cover fixed charges (interest expense) just 1.0x (1.05x necessary prior to an acquisition).
The Company historically has not been heavily reliant on debt funding; it ran with ~2.0x leverage in 2013 and 2014, which was debt taken on with the Southwest acquisition. Though current EBITDA is negligible, HWCC is ~2.5x levered on 2019 EBITDA. This figure assumes no debt paydown between now and 2019, though the Company ought to produce positive FCF and management’s priority is to prioritize FCF entirely for debt paydown rather than reinstating the dividend or repurchasing shares. Assuming 100% of 2018 and 2019 FCF (post investments in working capital) is utilized for debt paydown, leverage drops to ~1.7x. Though cash flow remained positive from 2013 to 2016, should the environment again worsen such that the Company requires funding, it ought to have plenty of dry powder in the revolver. If one assumes $15mln of annual cash burn, the Company would have over 5 years of runway.
Revenues
Revenues are generated via the sale of wire. The Company has no distinct business segments, yet holds ~56,000 SKUs. The Company sells into both MRO and project-based work across a variety of industries. As shown, revenues generally track the industrial production index, which recovered in early 2016 and is accelerating today. Resurgences in oil & gas-related capex or an infrastructure spending bill from Washington would fuel further upside.
Our assumptions for 2017 are 20% overall growth, implying $78mln in Q4 revenues, or 13% higher than 2016. Note that Q4 2016 included a 1-month contribution from Vertex, so this implies organic growth in the mid-teens range. This implies a slight acceleration from Q3, which is in line with both end-market indicators (rig counts, industrial production) and copper prices, resulting in growth in both volumes and pricing.
Cost of goods
The primary components in various wiring include copper, steel, aluminum, nickel, and petrochemical products. 45% of purchases come from 5 suppliers, though the Company is not dependent on any one supplier for any of the products sold; this concentration is more of a choice due to resulting buying power. COGS are almost entirely variable and depend upon the direction and absolute level of commodity / metals prices. As prices rise, the Company secures lower cost wire and passes it through to customers at higher prices. On an absolute basis, the Company prices on spread, which increases somewhat with metals prices. Management has noted on prior calls that the full effect of higher metals pricing comes through ~4-6 months later (also directionally in line with inventory turns). With copper prices continuing to march higher, the Company ought to report a strong Q4 2017 and Q1 2018 on the gross margin line, even past what was seen in Q3 2017. Management’s long-term gross margin range in 2009 was 23 to 25%. We see no reason structurally that this would be unattainable going forward, especially given the increased contribution from Vertex doing 38% gross margins.
Operating expenses
Salaries and commissions are largely fixed, through the commission component moves in line with sales. Based on incremental salaries and commissions vs. incremental sales from 2008 through 2016, we estimate that commissions are ~3.5% of sales. Going forward, the Company ought to leverage its existing salesforce such that Salaries & Commissions fall to 8.2% of sales by 2020. Other operating expenses consist of warehousing costs and largely fixed personnel, which ought to fall back to ~7.1% of sales by 2020 as inventory turns improve. Management noted that the business can sustain $450mln in sales without needing to bulk out its warehouse footprint. From 2009 to 2016, the business generated median incremental EBITDA margins of 23% and average incremental margins of 29%. Going forward, our assumptions imply incremental margins of 20-21%.
Working capital dynamics
Due to investments in working capital, cash flow tends to trail earnings by ~6 months (note 5-year average cash conversion is 162 days). Nevertheless, return on capital (net working capital & long-term debt) has potential. We forecast by 2019 and 2020 the Company will produce ROICs of 9.2% and 11.5%. Cash conversion is around 6 months. This is objectively high, yet is the nature of the business model as the Company’s core value proposition is in holding hard-to-stock inventory and providing it on a just-in-time basis. Second, the Company receives discounts from manufacturers for early payment, hence the ~2-week payables days. Though impacting cash flow timing, this comes through in better profitability. With an effective ~2.2% interest rate on the revolver, this trade-off is warranted. Finally, inventories have expanded in 2016 as a result of (1) preparation for 2017 growth despite lower 2016 revenues and (2) the acquisition of Vertex, which added inventory to the B/S immediately though sales will come through in future quarters. Thus, cash flow dynamics should improve over coming years.
Quarterly working capital dynamics are shown below. Through the downturn, the Company ran down inventory in order to preserve cash flow. As the Company receives new orders and has more visibility into growth, it has reinvested into its inventory. As turns are ~3x, inventory growth happens to lead sales growth by ~2 quarters. Assuming management can properly plan – which we believe they can based on successful 30-year careers in the business – this provides a proxy for continued sales growth.
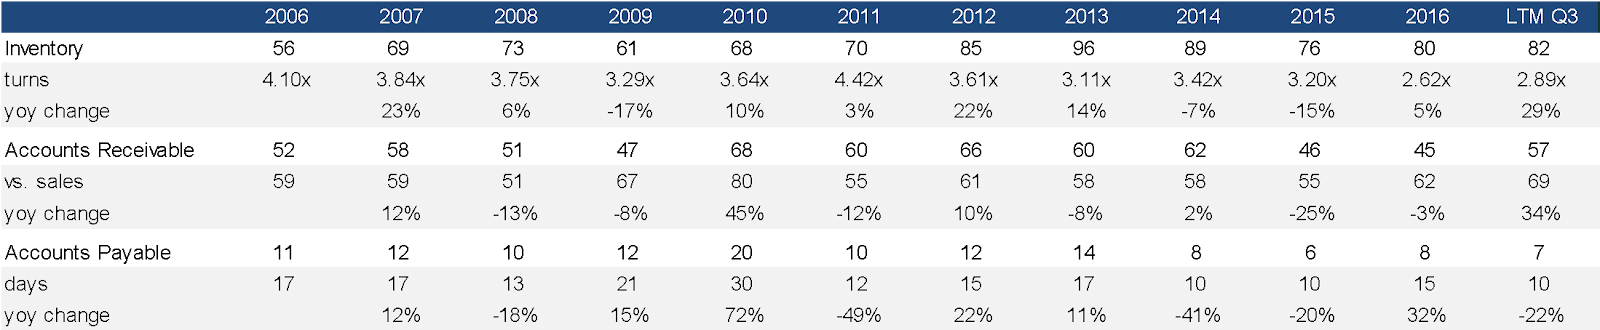
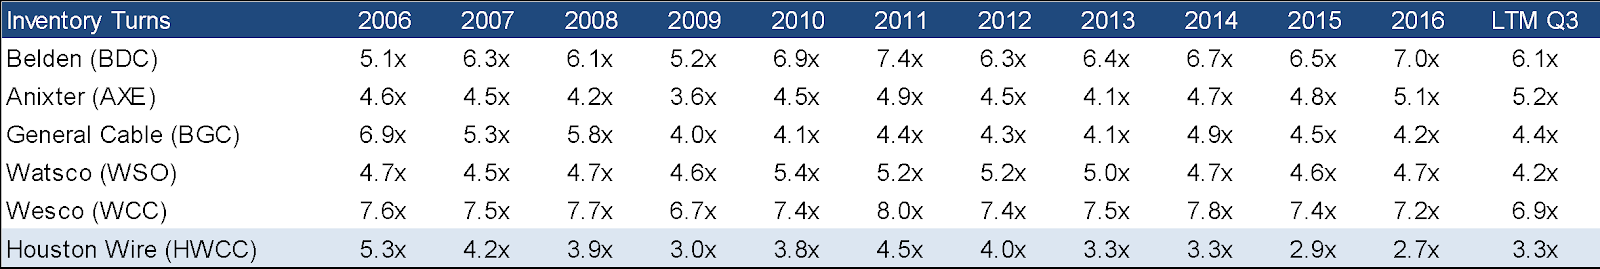
As shown, industrial distribution peers tend to run at 4-7x inventory turns. In earlier years, HWCC was able to keep pace, but this has fallen to 2.7x in 2016. Over the LTM ended Q3, the Company improved to 3.3x. This adds context to our confidence that the business can get back to 4-5x turns in due course.
In total, these assumptions lead the Company to generate $29mln and $36mln in 2019 and 2020 EBITDA, respectively. Note we dock the Company for minor investments in working capital going forward (primarily increases in A/R and inventory). Nevertheless, the business should do $18 to $22mln of FCF to equity in 2019 and 2020, for a high-teens FCF yield. Also note that in the investor presentation, the Company claims that they can exceed $1.00 in EPS. Management holds that the business would need to generate $400-450mln of revenues to reach this level, though margins and working capital management remain the key determinant.
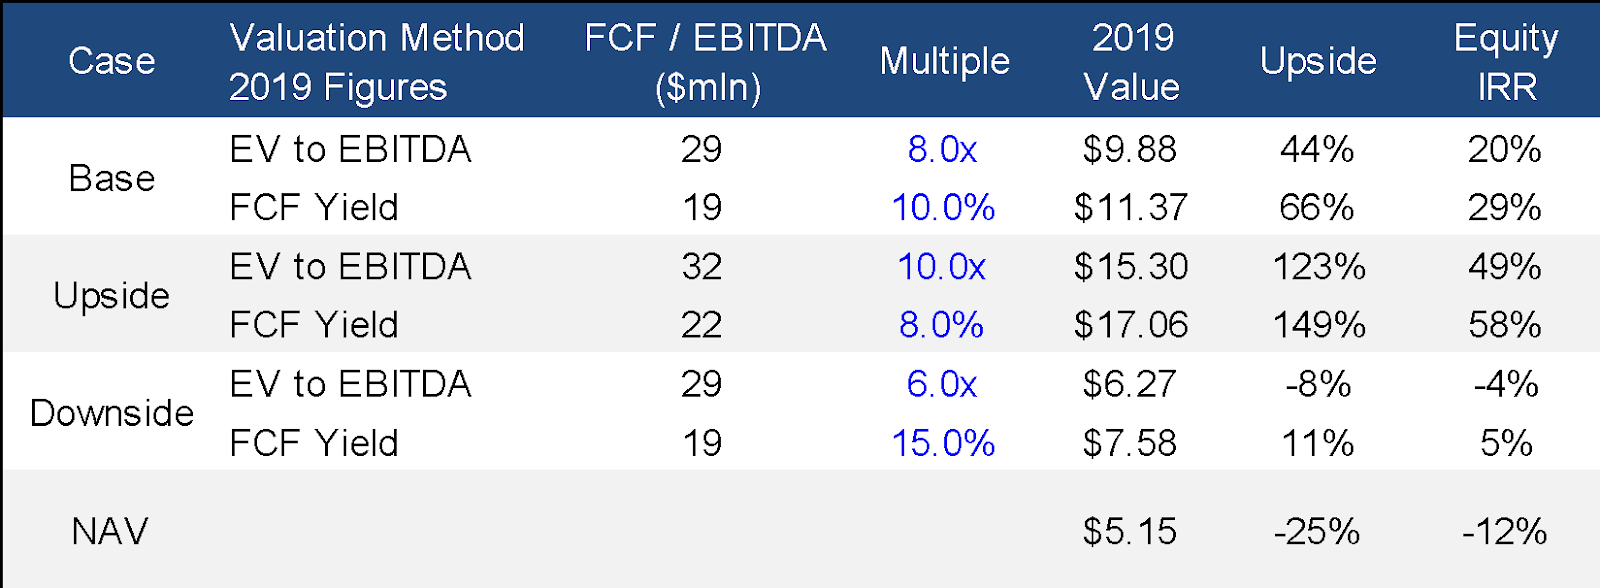
If the Company were to trade closer to industrial distribution peers at 8-10x EBITDA by 2019, shares ought to roughly double, for a respectable IRR. See the scenario analysis below (NAV explained below).
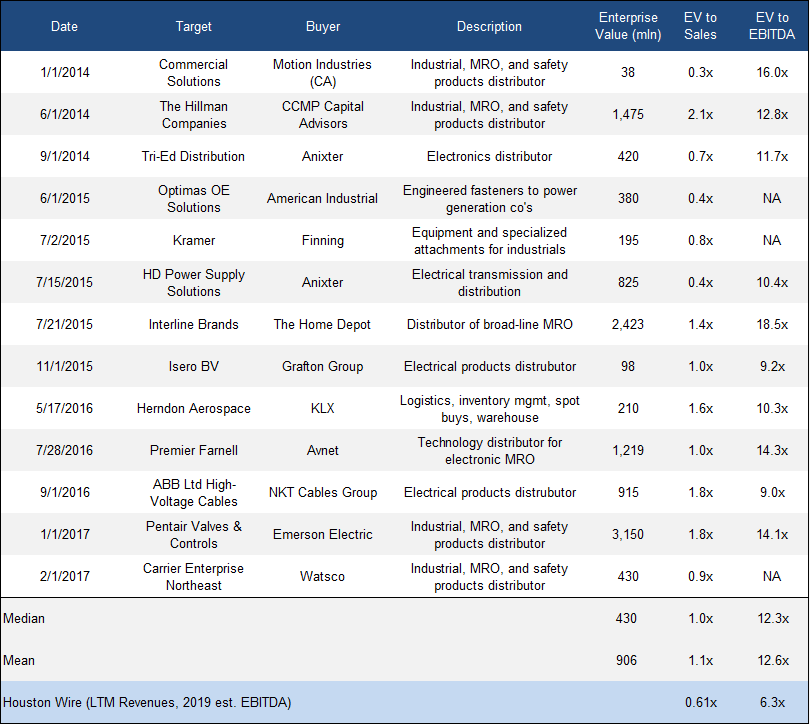
M&A / Private Comps
There is a fairly liquid market for industrial distribution businesses, with Pitchbook noting 500-700 transactions occurring annually. These include other industries such as aerospace, but the core business model is similar. These businesses generate interest from both private equity and public players, where scale provides a competitive advantage in the density of the distribution network and thus savings achieved on freight and warehousing costs. As shown below, these have tended to be consummated at low to mid-teens EBITDA multiples. HWCC currently trades at just 6.3x 2019 EBITDA estimate and 0.61x LTM Revenues. As earlier noted (not listed below), Prysmian (BIT:PRY) recently (December 2017) announced the acquisition of General Cable at 11.5x 2018 consensus EBITDA.
Downside / NAV Valuation
In November 2017, Raymond James valued the Company on a NAV basis, starting with tangible book value and adjusting for (1) inventory step-up, and (2) the fair value of land and buildings. As the assets of a distribution business are relatively standard in general purpose warehouses, there ought to be a fairly liquid market for the assets. RJ came to a fair market value of $5.15 per share, an 18% discount to the current price. Those calculations are shown below.
Catalysts
Earnings beats – end market reacceleration and higher metals prices ought to push revenues and margins past current expectations.
Sale of Company – on a normalized earnings stream, any respectable multiple would fetch a sale price considerably higher than today. Activist presence likely pressures the management team towards a sale. Natural buyers are private equity, Belden, General Cable / Prysmian, Wesco, Anixter, etc.
Risks & Mitigants
Commodities reverse course / coal exposure
Downside protection in hard assets. Working capital dynamics provide the Company steady cash flow through inventory run-down. Coal is now less than one-third of the business exposure.
Leverage
Can reduce debt via sale-leaseback transactions (see BXC etc.).
I and/or others I advise hold a material investment in the issuer's securities.
Catalyst
Earnings
Sale
| 1 show sort by |