| 2018 | 2019 | ||||||
| Price: | 41.16 | EPS | 6,85 | 8,25 | |||
| Shares Out. (in M): | 23 | P/E | 6 | 5 | |||
| Market Cap (in $M): | 930 | P/FCF | 0 | 0 | |||
| Net Debt (in $M): | 500 | EBIT | 0 | 0 | |||
| TEV (in $M): | 1,430 | TEV/EBIT | 6.5 | 5.5 | |||
Sign up for free guest access to view investment idea with a 45 days delay.
- Homebuilder
- Housing
- winner
- owner operator
- Multi-bagger
- LGI HOMES INC LGIH 02/09/2022
- LGI HOMES INC LGIH 05/05/2020
- LGI HOMES INC LGIH 09/27/2017
- BETA
- LIBERTY GLOBAL PLC GLOBAL GP LBTYK 06/06/2016
- Elanders AB ELANB:SS 12/14/2017
- LIBERTY GLOBAL PLC LBTYK 07/19/2019
- D.R. Horton DHI 03/31/2023
- Barratt Developments plc bdev 03/07/2023
- MERITAGE HOMES CORP MTH 01/27/2019
- LIBERTY GLOBAL PLC -LILAC GP LILAK 07/28/2015
- CAVCO INDUSTRIES INC CVCO 10/01/2023
Description
We think the recent strong sell-off in homebuilders and LGI Homes in particular has created a very attractive and timely opportunity. We find the opportunity to invest in LGI not only attractive due to the company's low forward earnings multiple of only ~ 5x, but also because of its potential to compound earnings at 15-25% for many years without the necessity of industry growth - a normal economic environment should suffice. Apart from the low valuation, we are also comforted by LGIs owner operator/high insider ownership, the company’s industry-leading margins, high returns on capital, much better debt serviceability, and its well-honed sales approach and highly rated & sought-after product.
LGI is now down roughly 45% YTD while not only hitting but increasing this year’s guidance/targets. The market clearly struggles to properly value the company - a common occurrence since the company’s IPO about five years ago if one looks at the business trajectory and trading history. Here is bloomberg snapshot for a quick glance.
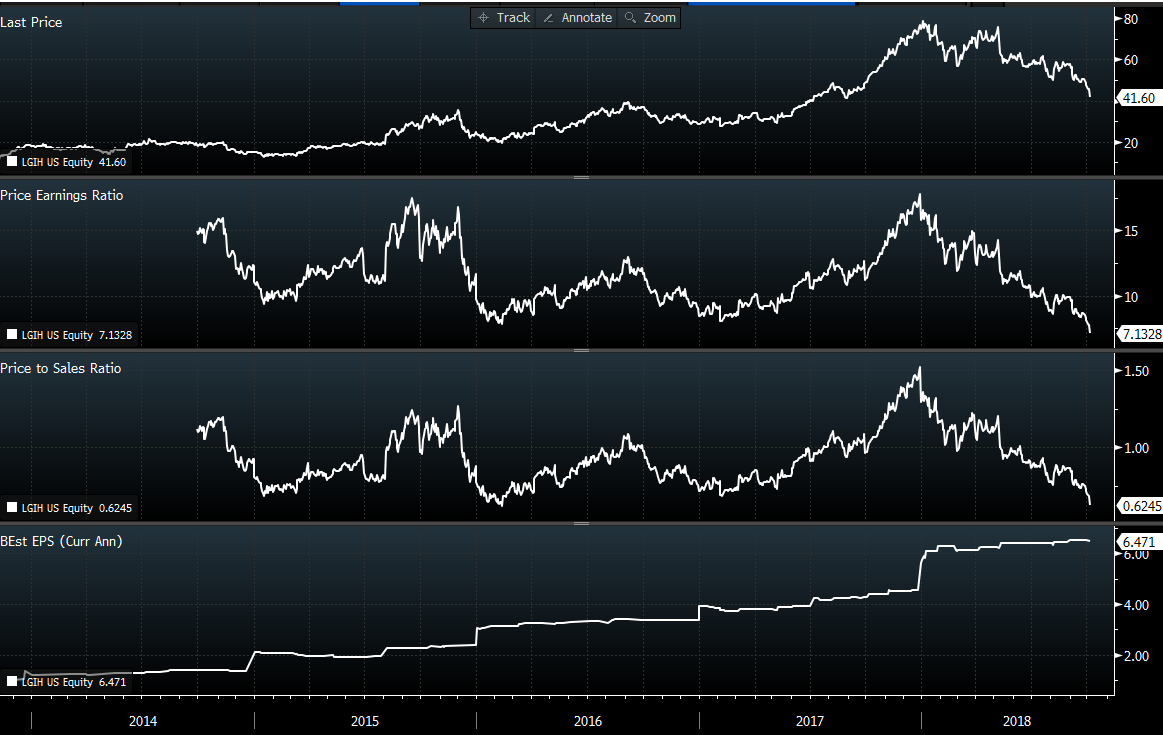
We think a big part of it comes down to a broad underappreciation of the company’s ability to outperformance its peers in important key metrics but also the general, not completely unjust, but likely too strong dislike for the sector. The recent valuation at LGI’s 52W high of 80$ a share which translates into roughly 10x FWD earnings makes much more sense to us than the current valuation at 40$ a share. By buying LGI at its current valuation one should now not only be able to profit handsomely from future earnings growth but also from a normalization of LGI’s earnings multiple to a much more appropriate 10x or higher again. At the same time, the low valuation provides one with a decent margin of safety given that neither the company’s product or current supply point to anything other than a short-lived lower sales and earnings level when the next recession will push demand below the normalized level for a while.
We liked Rearden’s write-up from a little over a year ago. It’s a short write-up, but it lays out the main parts of the thesis very well. It is probably best to read through it and also the ProBuilder report https://www.probuilder.com/2016-builder-year-lgi to get a grasp of LGIs business model instead of me pretty much copy-pasting it here again. So far Rearden has been correct about LGIs fundamentals, but while earnings are up around +50% YoY the stock price is now down -10%. Given that we think that the most likely scenario is continuing earnings power growth for the foreseeable future and resumed growth after the next recession (we ever it hits), we think this is now an even better idea.
Apart from adding value through bringing up the idea again, we will try to add some data and commentary about LGIs business quality, why we think earnings are destined to grow further and why the market is currently way too pessimistic and pricing an unrealistically bad scenario.
First some financial data on LGI and the 15 largest listed peers out of the top 25 US home builders:
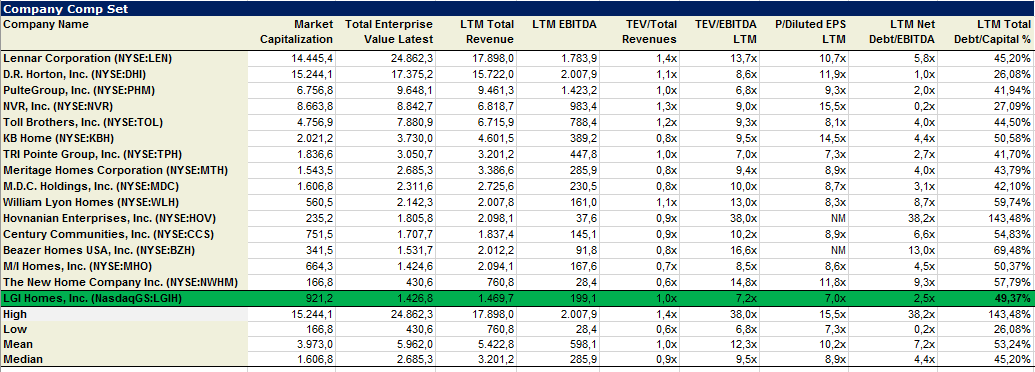
Obvious things to point out by just glancing at the tables
• Based on LTM TEV/EBITDA of 7,5 and P/E of 7, LGI is running for the rang of the cheapest valuation among its peers, head to head with TPH, a very different kind of builder with almost 3x ASPs and half its business in pricy California (but with over 7 years of 90% owned land supply in the state, if someone is into that)
• In terms of capital structure, LGI comes in industry average with around 50% debt, however, due to is higher returns on capital its debt serviceability is much better, with Net debt/EBITDA at 2,5x which is only half the peer group’s average of 5x (excluding distressed HOV).
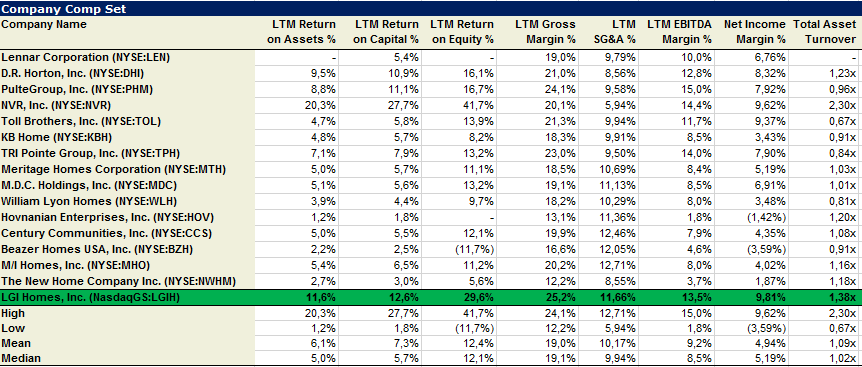
• LGI is leading in terms of GM and is close to best in class with operating and net margins. Just to mention it, the table shows GMs without adjusting for capitalized interest, but the conclusion would be the same. LGI adjusted GMs hover around 27%.
• SG&A is above average but has more room for improvement. Over the last 5 years, SG&A declined every year - in total by as much as 5% to now below 12%. LGI recently guided to another year of improvements. LGIs SG&A is certainly elevated due to its strong historic and continuing (+20-30% next year) community growth initiatives. Over time a slower growth pace and additional SG&A leverage via scale will provide room for further net margin improvement or constant net margins with lower GMs.
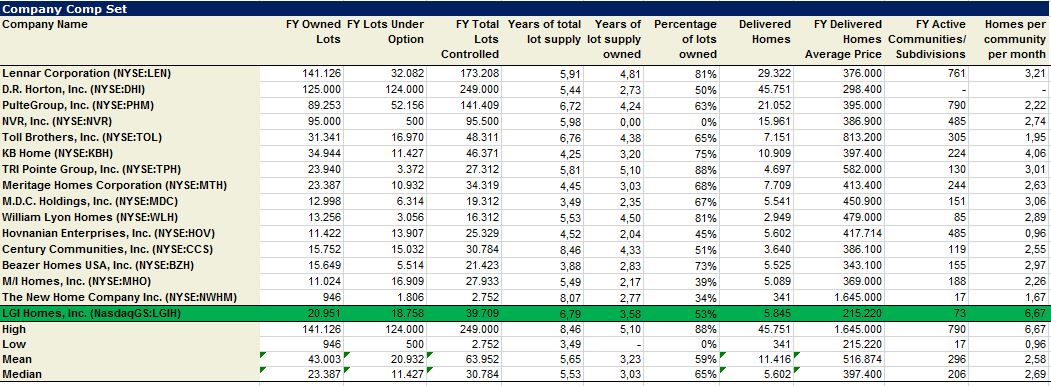
• LGIs leading asset turnover coupled with its high margin lead to what we as investors love to see, high returns on capital and equity. By looking at the asset turnover of the homebuilders it makes sense to also look at 1) how much land is owned vs. optioned and 2) how many years of supply is that based on their current sales
.
• For example, NVR achieves its outliner returns on assets/equity primarily by not carrying any land on its books, not because it has a better or more efficient building and sales machine. Not that this is bad, the model has delivered very well so far. NVR has been a fantastic performer. Even if you bought the stock in 2006 at a once in a lifetime cyclical peak you would have outperformed the S&P500 to date.
• Next up in line in terms of asset turnover is LGI with a 40% better turnover than average. However, LGI carries an above average lot supply with close to 7 years of current sales with a 50/50 mix between owned and option land on its books. So, in LGIs case it is not a lower land base, it is the company’s more efficient built and sales machine that is driving the higher turnover.
• The greater efficiency shows up in LGIs industry-leading number of homes sold/ community/month of 6.7 vs. an industry average of 2.6 homes. An impressive achievement that it is not a current outliner. The company has been able to achieve a sales level above 6 since there is public data and according to discussions with management also prior.
• Another obvious key difference from the table is LGIs average home selling price. Due to the company’s singular focus on the affordable entry-level segment, last year’s ASP of 215’000$ is only about half the industry ASP.
Before discussing the upside, some additional information to get comfortable with the business performance in bad times
From the IPO prospectus, we can learn that the company has been profitable every year since its founding in 2003, despite the massive housing downturn and has never had to take an inventory impairment. That doesn’t sound too bad and according to Builder Magazine, LGI was the only builder out of the top 200 that showed revenue and closing growth between 2006 and 2008. Although we don’t know the company’s sales level and P&L prior to 2011. One can get a lot of comfort from the fact that LGI was able to sell 6,5 homes/community/month with a 28,5% GM in 2011 - the trough year in housing, after a 75% decline from the prior peak with only 306’000 single-family homes sold in that year. So, in the absolute worst year in terms of new sales we have on record, the company sold more than twice as many homes per community at full margin than its peers sell even in good times. A very notable achievement. One can argue that the company was way smaller back then and that prices in its main state TX held up much better than in other states, but new sales activity in the company’s markets also declined dramatically during that time. We think it is fair to say that the company’s model has been tested in bad economic times and that the temporary outcome for shareholders should still acceptable.
Some comments/data around the recent stock sell-off
After declining most of 2018 together with the other homebuilders, LGI recently sold off an additional 10% on the day it published its September closing number together with a reiterating note that it's recently (August 07) raised guidance for the year remains unchanged and as healthy as it is. However, the headline showed a year over year decline of -11.8% in total monthly sales and a -16% decline in monthly sales per community to 5.9. This might look scary on first glance, but the data immediately looks a lot less scary if one pulls up the monthly sales data going back to 2014. As one would expect, there is a natural fluctuation in those numbers and there have been pullbacks and lower monthly numbers before.
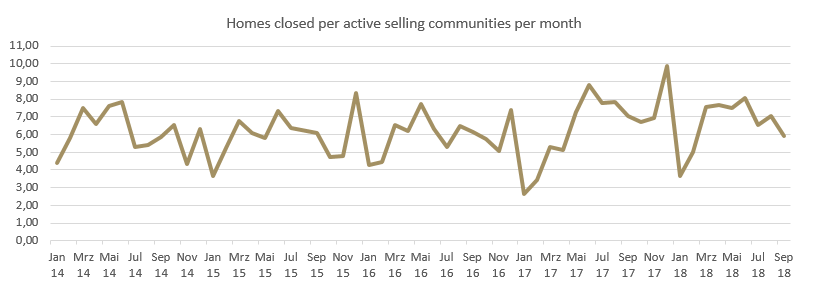
In addition to the natural fluctuation, last year’s Q3 numbers saw strong wholesale numbers included in the monthly count, whereas there was likely less active this Q3 based on what Eric Lipar said on the Q2 call.
James C McCanless Wedbush Securities Inc.
Research Division Okay. And then on the investor homes versus direct to consumer homes, are you guys still seeing a similar operating margin on one versus the other? And -- but -- do you have a target or a limit of the amount of investor homes you want to sell this year?
Eric Thomas Lipar Chairman & CEO
It is a similar operating margin, for sure. And then not only is it a similar operating margin, but in the case of most of these sales, are coming from communities that are the -- you accelerate the closings. So it's very accretive not only from an operating margin but also return on equity, return on assets, those type of metrics as well. We are limited on how many we could sell this year from a standpoint of, we need to have lots finished and available to go. We don't have an excess supply of lots, so it takes planning and really working with the investors and getting deals under contract. So it's a little bit more of a lead time in order to produce wholesale closings.
More importantly by reiterating the guidance which wouldn’t have been necessary to do (management has historically been very conservative with guidance), the company is guiding to a rebound in monthly closings. It would hit the midpoint at the high number of last year’s closings, and show a single digit decline on the low end. Since there is a 30-45-day lag between sold homes and closings, the company pretty much knew how September would shape up while raising guidance on August 7 and had an even more information while reiterating it just days ago. So we think it’s the wrong to foresee anything more than a slight decline in demand based on those numbers. In addition, a slight decline will be more than made up by strong community growth next year. We think the most likely scenario is that monthly sales stay in its historical band for the foreseeable future and earnings will grow due to strong community count growth next year.
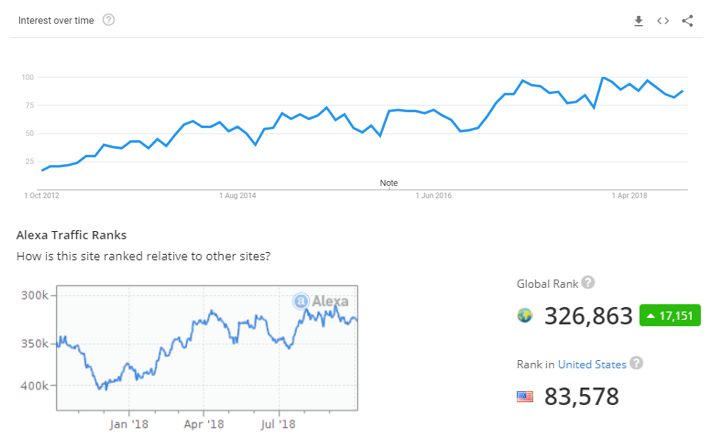
Another supporting data point (a weaker one but still) at least in terms of general interest in LGIs products is the companies web traffic, that continues to climb upward on both Google trends and in terms of Alexa ranks.
Some additional comments/info that point to healthy demand for LGIs products and support the investment case.
First, some commentary by the CEO of KB Homes from 25th of September. His general commentary was quite upbeat. Below are some relevant parts on demand. For context, KB Homes price points are above LGIs ASPs. LGI is focusing only on the very affordable segment, where there is the greatest shortage nationwide. The price moderation/slowdown that people are worried about is happening at high price points.
Part of an answer to a demand market: CEO: Like you, I have seen all the coverage in the media and the investor world on where we're at in the cycle, and I keep getting back to the current inventory levels, which are low. And while the national numbers are 4 months, many of the markets we're in today it's still 2 months, 1.5 months, and then when you get into the price points we play at, it's even less. So there's not a lot of inventory out there at the affordable price bands, and much of the headlines, I think, are tied to higher price points that are seeing some slowdown.
More on demand: CEO: We haven't seen it yet, Stephen. We - the 2 things we track. Our LTVs, the qualifying ratios of our customers, the down payment, the FICO scores, that hasn't changed at all. Our average footage also hasn't changed at all, and for me, that's another proxy for what's going on with the consumer in that it's a consumer picking that size home, not us building the spec and then selling it. So footages are holding. Our LTVs are holding. We've been moving to more affordable areas, so it's the same-sized home. Price may go down because we've moved 2 miles or 5 miles further from the employment centres, but we're not seeing any indication of our customer today that they're feeling a pinch.
More on demand specifically in Texas: Analyst: First one is I'm just looking at the tape right here. The headlines are reading that KB Home sees housing slow down at higher price points. I don't think that's what you said, but Jeff, that might -- can you maybe talk about if there is any moderation at higher price points, where you're seeing it? Maybe can you maybe help us what are the price points that, that could be happening? His Answer: I'll give you an example. In many of the Texas cities, sales are a little slower when you get above $400,000, $400,000 to $500,000, and it's not a price point that we play at. I think, to get within those states or that state in this example, the sales are still okay. They're just not as strong as they were. But that's not a price point we play in so...
And there we go another one demand: CEO Again, I think, if you get into a specific city and look at where the price cuts are occurring, it's at the higher priced resales as well. The more affordable product, there isn't any inventory out there. So I don't think -- if you look in a city, however, it's defined as affordable, I don’t think you'll see a lot of inventory. A lot of the coverage on the resale side is supply constrained at the affordable levels, which is perfect for us.
Some more commentary from the recent Lennar CC on Oct. 3
CEO answer to a question on absorption trends Texas and Florida: So if you look at our other major markets, which are really Texas and Florida, I would tell you that we had strong performance in those markets. Texas was up significantly year-over-year. That was almost 20% in new orders as a whole state. If we look at Florida, the Florida markets continue to be robust. That said, there are -- in the Dallas market, at the higher end of the price points, that market has gotten a little bit softer. But really across the board, if you're sub-$300,000 in price point, it's a very strong market. And we saw continued strength in Florida. So pretty much across the board, other than on the West Coast, where there was a little bit of softness since prices have increased dramatically, we feel that we're in a relatively normalized market right now.
And more on general demand from CEO: And we look at the normalized demand level for the country and though some might argue that a $1.5 million isn't the same as it used to be, we've been producing at a significantly lower level for the better part of the past decade. So we've been building pent-up demand. I think our view -- and I think generally, the industry view is that embedded in these numbers, there is a demand pattern and basic economic strength underlying it that will help correct and drive the market forward. So I would say pretty aggressively that we're not protecting backlog and certainly nothing reflective of what we've seen in past cycles. Instead, I think there's a pause; I think there's a catch-up; and I think that we'll, with economic drivers driving forward, see a resumption of normalization of the patterns going forward.
Some data/info from Zillow’s recent Q2 2018.
Straight copied commentary from the report:
• Inventory of homes for sale is very low and getting lower. Inventory constraints are particularly acute among entry-level and median homes – the exact homes sought by first-time homebuyers and young families.
• New construction has thus far failed to get back to pre-recession levels, especially for single-family homes.
• Homes that are on the market are selling faster – currently, homes spend ten days less on the market before selling than they did a year ago.
• Millennials do value homeownership, but many are finding it difficult to attain, and more young adults are living with their parents.
Plus, some charts on inventory levels and affordability in the market.
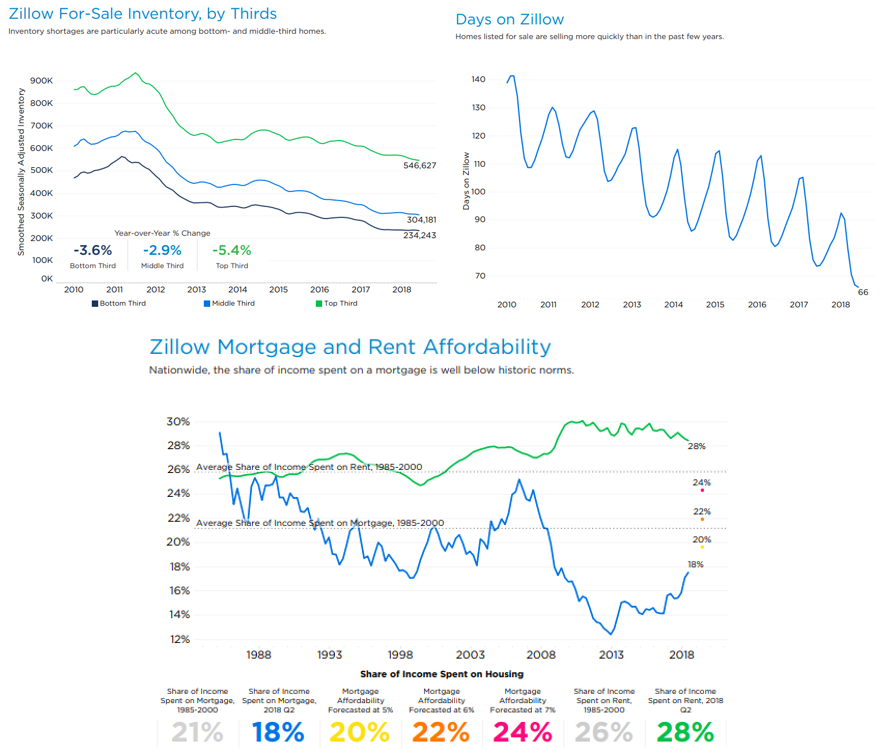
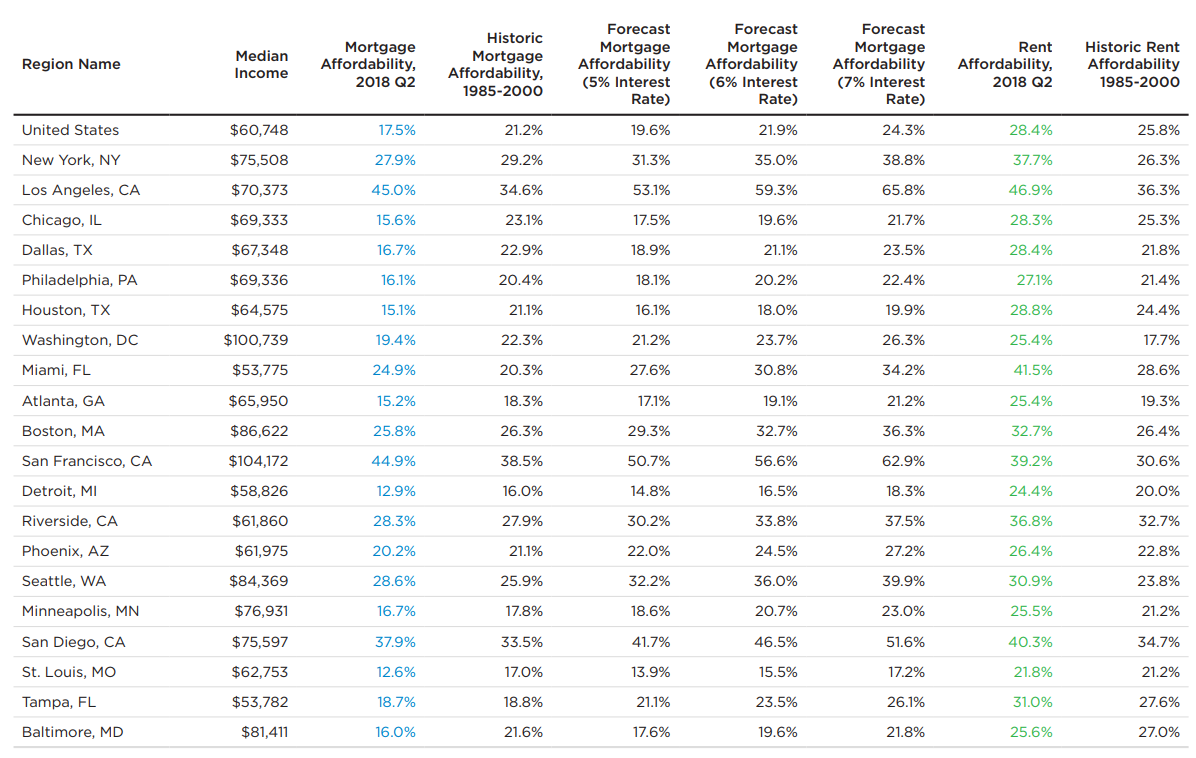
LGI is primarily converting renters to home buyers via its direct mail marketing strategy. The recent rise in mortgage rates should not kill LGIs value proposition as the data from Zillow shows. In addition, the markets were LGI has a major presence are more affordable than average as can be learned from the following table. General mortgage applications are also holding up.
Finally, some commentary about the earnings upside.
If the market conditions don’t change a lot and LGIs model continues to work as it historically has - it did so already under horrendously bad conditions, there is great earnings potential. LGI currently operates only in 15 states and in slightly over 30 markets. There is a lot of room to go deeper into existing markets and in continuing on the geographic expansion course the company has been on in the last couple of years. The company has already proven it model works across the country. We think it is now primarily a question of ROE in how fast the company can expand its footprint further. The company has mapped out a goal to get to 240 selling communities from its current 85-90 at year 2018.
The home building market is easily large and fragmented enough for LGIs superior model to gain the necessary market share and achieve its target. LGIs current share is at roughly 1%. The average community count of LGIs peer group is 300. The company has basically already mapped out how to get to its desired 240 communities which translates into an earnings multiple below 2x from here. We think at this price the odds are highly in our favour to achieve a very satisfactory investment return. Based on LGIs current ROE, the company could potentially get to its targeted community count in just 5 years. The actual outcome may well take longer due to changes in the economic environment, but even if it takes longer it would still be very attractive.
And as an addon a basically totally unnecessary personal narrative, but the situation reminds me of Fiat Chrysler in 2014, when US car sales at that time were more less back to normal but there was this one company in an otherwise generally unattractive industry laying out a path for you to get less than 2x earnings 5 years out. The home builders in general, may not turn out to be good investments, just as GM and Ford have been dead money since 2014, but the prospects for LGI in the absence of industry growth look much more like Fiat Chrysler’s back in 2014 did.
Also just to mention it, there is an deep in the money convert outstanding that takes the share from 22.6m to 25m once converted. The numbers at the top and in the table are not adjusted for that, but the small impact doesn't change the premiss of this idea.
I and/or others I advise hold a material investment in the issuer's securities.
Catalyst
ongoing earnings growth
change in sentiment
next earnings release
short term, normailzation of valuation to industry average for this above average beast
| show sort by |