| 2016 | 2017 | ||||||
| Price: | 41.31 | EPS | 0 | 0 | |||
| Shares Out. (in M): | 155 | P/E | 0 | 0 | |||
| Market Cap (in $M): | 6,400 | P/FCF | 0 | 0 | |||
| Net Debt (in $M): | 0 | EBIT | 0 | 0 | |||
| TEV (in $M): | 0 | TEV/EBIT | 0 | 0 | |||
Sign up for free guest access to view investment idea with a 45 days delay.
- Private Equity (PE)
- Asset Management
- OAKTREE CAPITAL GROUP LLC OAK 03/06/2018
- OAKTREE CAPITAL GROUP LLC OAK 06/03/2014
- OAKTREE CAPITAL GROUP LLC OAK 06/03/2014
- OAKTREE CAPITAL GROUP LLC OAK 05/20/2012
- OAKTREE CAPITAL GROUP LLC OAK 05/20/2012
- Oaktree Capital Management OAKTRZ 12/17/2010
- BETA
- FIVE OAKS INVESTMENT CORP OAKS.PA S 03/16/2017
- EQT Corporation EQT 09/11/2020
- BLACKSTONE GROUP LP BX 08/04/2016
- KKR & CO LP KKR 01/27/2015
- FORTRESS INVESTMENT GRP LLC FIG 09/19/2015
- Tarpon Investimentos TRPN3:BZ 03/01/2013
Description
Undervalued on-balance sheet minority investment, off-B/S accrued incentives and other net cash and investments suggest around $18 in static asset value, to say nothing of recurring cyclically depressed management fees that should eventually positively inflect as Oaktree deploys the largest slug of shadow capital since 2008/2009. OAK A class units might be worth close to $55-$60, maybe more if past fund performance is prologue to future returns. Senior executives own about 70% of Oaktree Operating Group,[1] with founders Howard Marks and Bruce Karsh, retaining nearly 25% economic control of the firm.
Overview
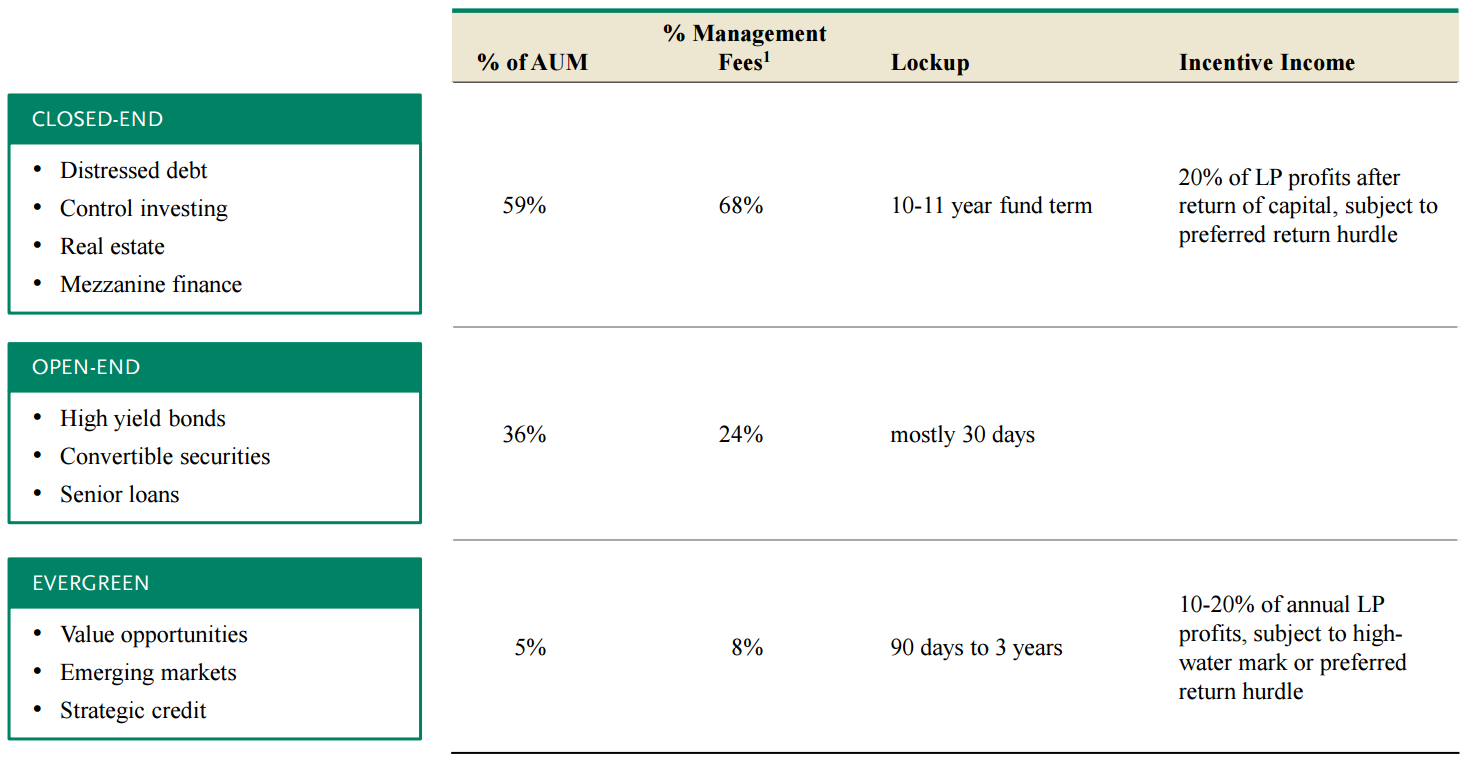
Oaktree’s foundational expertise resides in credit, reflecting the background of its two founders, Howard Marks and Bruce Karsh, who were senior executives leading the high-yield, convertible and distressed effort at TCW Group during the mid-80s/early-90s before founding Oaktree in 1995. Closed-end funds are responsible for nearly 70% of management fees and the distressed debt subcategory is OAK’s beating heart.
All manner of asset class subphyla has organically and opportunistically unfurled from these foundational strategies. Principal investing – direct capital infusions into distressed companies with loan-to-own intent and private equity (to a lesser extent) – naturally evolved from distressed debt investing; US High Yield spawned US Sr. loans, which – in collaboration with stressed financial conditions in Europe and prior experience in European principal investing – begot European Sr. loans in 2009, which in turn led to CLO management in 2014; PPIP[2] participation firmed expertise for a dedicated real estate strategy in 2012; infrastructure investing through OAK’s Highstar acquisition in 2014 complemented its existing energy infrastructure strategy, and so on.
“Stepping-out,” as OAK calls it, in deliberate, cautious and adjacent fashion has allowed the Fund to offer more granular liquidity and return strata for new and existing clients while staying close to its core competency and maintaining philosophical cohesion. Over time, Oaktree has leveraged long-standing client familiarity with one or two strategies to cross-sell others – 77% of AUM is represented by LPs invested in multiple strategies[3] – cultivating an ever-stickier LP base from which to raise future capital.
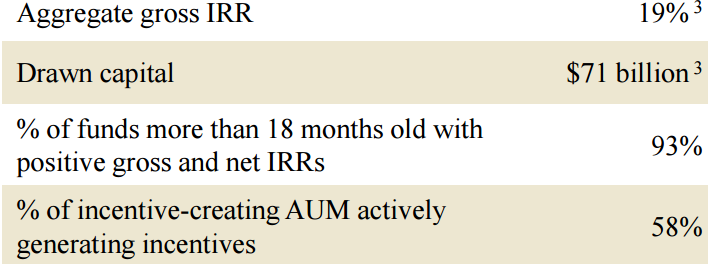
And it’s worked out swell, even with little to no fund leverage. Look, see:
[1] In which the publicly-traded entity of which we are unitholders has a minority interest.
[2] Public-Private Investment Program - designed by the US Treasury to remove distressed assets from beleaguered bank balance sheets – was a highly profitable gambit for all eight asset managers qualified to participate.
[3] Clients in 4+ strategies constitute 38% of AUM
The best way to acquaint yourself with its overarching investment framework is to read through Howard Mark’s (Chairman) monthly letters. He’s achingly repetitive: maintain a long-term perspective, assiduously focus on downside risk (permanent capital impairment), deploy capital opportunistically in light of predictably manic markets, and a slew of other value-oriented mantras that might come across as exhaustingly truistic except that Oaktree actually lives it.[1]
Traditional long-only managers and many Alts, benchmark constrained or just unwilling to forsake assured management fees now for uncertainly superior returns later, will intensify capital deployment in frothy environments when money is abundant and securities are at their richest.[2] Oaktree zigs these zags, raising heavy amount of capital during and just preceding pessimistic periods[3] and realizing value in better ones.
For instance, in 2001 and 2002, the Oaktree raised $3.5bn (on a base of $17.9bn), positioning it for outsized returns from opportunities arising from corporate accounting scandals and the telecom bust. From January 2007 through May 2008, OAK positioned more aggressively still, raising $10.9bn for its vaunted OCM Opps VIIb on an existing AUM base of just ~$36bn, calling down $9.8bn of capital and investing most of it in senior bank loans post-Lehman. While turbulent financial markets prompted a $10.8bn AUM decline in 2008, Oaktree recovered nearly 3x that amount in the subsequent 2 years and created $2.7bn in aggregate incentives. Following the financial crisis and into the recovery, OAK curtailed the size of new closed-end funds to a fraction of Opps VIIb.
A keen appreciation for market cycles extends beyond investment strategy; it informs fund structure - OAK uses little leverage in its funds - and its business activities - at various points in its 20-year tenure, in response to limited investment opportunities, Oaktree has ceased marketing on various fixed income funds, deferred fund raising, intentionally downsized funds, turned away capital[4] and returned capital from distressed debt funds prior to the end of their investment lives.[5]
“…we are not going around high-fiving in an environment like 2013 or 2014, where the investment pickings are slim. We prefer it when securities are in the bargain basement, and investors are depressed and panicky and forced sellers. And we haven’t had that and we feel that if we buy cheap, there will always come a time eventually when we can sell dear and harvest more earnings and incentives. As I say, the whole thing starts with buying cheap. And we kind of lick our lips when the market becomes more in disarray.”
- Howard Marks, 4q14 Earnings Conference Call, 2/9/15
(In response to last year’s risk sell-off):
“Developments like these are indicative of rising pessimism, skepticism and fear. They’re largely what Oaktree hopes for, since – everything else being equal – they make for vastly improved buying opportunities.”
- Howard Marks, On the Couch, January 2016
OAK’s conference calls, when listened in tandem with those of other asset managers, reflects the firm’s contrapposto: while most asset managers lament recent market dislocations, OAK’s management appears giddy about the prospect of more mayhem. Counterintuitively and uncharacteristically, OAK is an asset manager that actually creates value in challenging market conditions and in fact, Oaktree’s largest distressed funds have been the best performers.
While an investment in OAK is by no means hostage to the opinions of a market/macro dilettante like me, I’ll just say that to the extent that the up/down of risk assets has significantly and unfavorably skewed, you want an asset manager that has demonstrated:
1) an ability to raise armfuls of capital, independent of market conditions;
and
2) prudence to flex that rare power at the right time.
And while that’s obvious, consider how infrequently you see both attributes in happy accord. While closed-end fundraising across Alts is flush sync with contemporaneous market conditions - reflecting a heavy bias towards credit-dependent, pro-cyclical asset classes like private equity and real estate - OAK flexes fund size with investment opportunity set.
[1] To be more sublimate-corporate, OAK’s website tells us that the firm’s investment philosophy consists of “six key tenets - risk control, consistency, market inefficiency, specialization, bottom-up analysis and disavowal of market timing…”
[2] For value types, the cognitive dissonance is usually resolved with an unobjectionable head-nod to the impossibility of market timing that creates a false choice between trading on macro and fundamental security selection.
[3] Oaktree’s largest distressed debt funds have also been its best performers.
[4] Including $4.5bn for OCM Opportunities Fund VII, forgoing ~$68mn in management fees.
[5] $5bn from vintage 2003 and 2004 distressed debt funds.


During the latter half of last year, after a long dry spell, OAK seemed increasingly optimistic that investment opportunities in distressed credit were finally materializing:[1]
…And really, for the credit investor, we have our first opportunities in several years. We've thought that the environment was lackluster. I think I told you last year and maybe the year before that that our mantra for four and a half years has been moved forward but with caution.
We didn't think there were compelling opportunities to move forward, and we thought there was a great need for caution. Now, of course, there are opportunities. I mentioned to Alex that there's this old Chinese curse, you should live in interesting times. Times are more interesting now, for some, it's a curse. They say in golf that every putt makes somebody happy. And so, some of the price declines and some of the weakness, which has been noted, so far, makes the prospective buyer very happy and the holder very unhappy. But we've raised a lot of capital over the last year and a half to be prepared for an opportunity that we believe was coming.
And now, we are more interested now that it seems to be here, we have bonds that have gone from 90 basis points to 60 basis points in the last few months, and not only in the energy sector. And we had a dinner here last night, Jay and I did. And one of our colleagues from the Distressed Debt group, who was supposed to be there from L.A., begged off. He says, again, I'd like your permission to stay in L.A., there's too much for us to do.
Well, believe me, it's been a long, long time since you could say there's too much for us to do. Maybe actually seven years, fourth quarter of 2008. In nearly post-Lehman, there was too much to do. And now, there is again, but it's been a long time.
- Howard Marks, Goldman Sachs Financial Services Conference, 12/8/15
“I would say we are probably nearing a cyclical low in fee related earnings, both dollar-wise and margin-wise and looking towards 2016, 2017, presumably these funds come online, start generating fees based on full committed capital. Eventually Xb will do so and so the increase in margin could be meaningful.”
- David Kirchheimer (CFO), 2Q15 Earnings Conference Call, 7/28/15
But then, markets shrugged off this bout of disruption and continued their complacent upward grind. As attractively priced assets have become scarce once again, management’s optimism has considerably waned:
“Low interest rates, ample liquidity and a search for yield continue to sustain the credit markets and buoy the equity markets, creating a somewhat challenging investment environment for our countercyclical investment strategies.
Well I think that clearly when the Central Banks take the risk for your rate to zero, all other rates kind of emanate from that in the capital markets line kind of phenomenon. So it’s all a function of that. Now we have adjusted downward our client’s expectations and our own expectations as to what our strategies can provide. As I recall Bruce, when we started off at 1988, we thought the stress could do 25% to 30%, and then we’ve had occasions since then, when we said 30% or more. And we are not saying 30% anymore or 25% or 20%, but we are hoping for example to get 15%, and we are targeting 15% in the investment decisions that we make, and we still believe we can make 15% and we may fall a little short of that.”
- OAK Earnings Call (7/28/2016)
(For more commentary on this issue, see the following scuttleblurb posts – here and here).
Consequently, the realization of latent management fees from OAK’s considerable $13bn in shadow AUM was pushed back to late 2017, and prompted units to sell off by ~15% over the last 6 months. But, to the extent you believe in business and credit and/or that we’re in mature phases of one, I can think of few asset managers better positioned to competently and aggressively seize on a downturn, while also presenting manageable downside protection (at the very least, its counter-cyclical bent offers attractive correlation properties for a net long portfolio).
OAK has raised an unprecedented $28bn of capital over the 18 months ($21bn at its closed-end funds) and sits on $13bn in shadow fee-generating AUM. The last time OAK invested anywhere close to this amount of shadow capital was back in 2008/2009.[2] Significantly, the enormous capital commitments from those latter vintage years’ funds have been largely liquidated at this point, meaning there aren’t lumpy fund roll-offs offsetting this new FEAUM - the attendant management fees will be largely incremental.
[1] Marks, from his January 2016 memo On the Couch, “we may be just in the early stages of a downward spiral in corporate performance and credit market behavior. Thus, while this may be ‘a time’ to buy, I’m far from suggesting it’s ‘the time.’” (emphasis his).
[2] As mentioned in the Alt addendum, Oaktree doesn’t charge management fees on committed capital until the investment period commences. The investment period start date is at management’s discretion and can significantly lag capital raising. Rather than immediately draw down committed capital or jump the gun on the investment period start date in a lukewarm investment environment just to scalp management fees, a scrupulous asset manager like OAK, loathe to compromise net returns to LPs, will sometimes just roost on it, forsaking easy management fees until compelling opportunities present themselves.

Valuation
I had a downside scenario analysis prepared but removed it from the write-up because it was even more grossly assumption-laden than my base case scenario. The downside case really depends on context. For instance, if yields continue to grind tighter and credit assets become even more expensive, OAK’s significant uncalled capital would probably continue to sit fallow, negatively impacting margins/FRE…but, this downside would probably be somewhat offset by continued inflows into OAK’s more traditional credit strategies and into Doubleline, higher open-end FEAUM, higher marks on OAK’s proprietary investments and greater accrued incentive fees. In a bear case prompted by fund underperformance, one might see fund outflows all around at the same time that legacy investments are being liquidated. Obviously, I think the latter downside case is remote. So, instead, I thought it better to sketch my base case skeleton below and let the reader fill it with as much muscle or fat as he/she chooses. I suppose I could also add further fuel to the bull case by iterating that “mega-alts” will be taking share from smaller funds, accumulating assets from growing sovereign wealth funds, and tapping new high net worth distribution channels….I don’t know, maybe.
I’ll start with a static asset value seed and sprout to a base case.
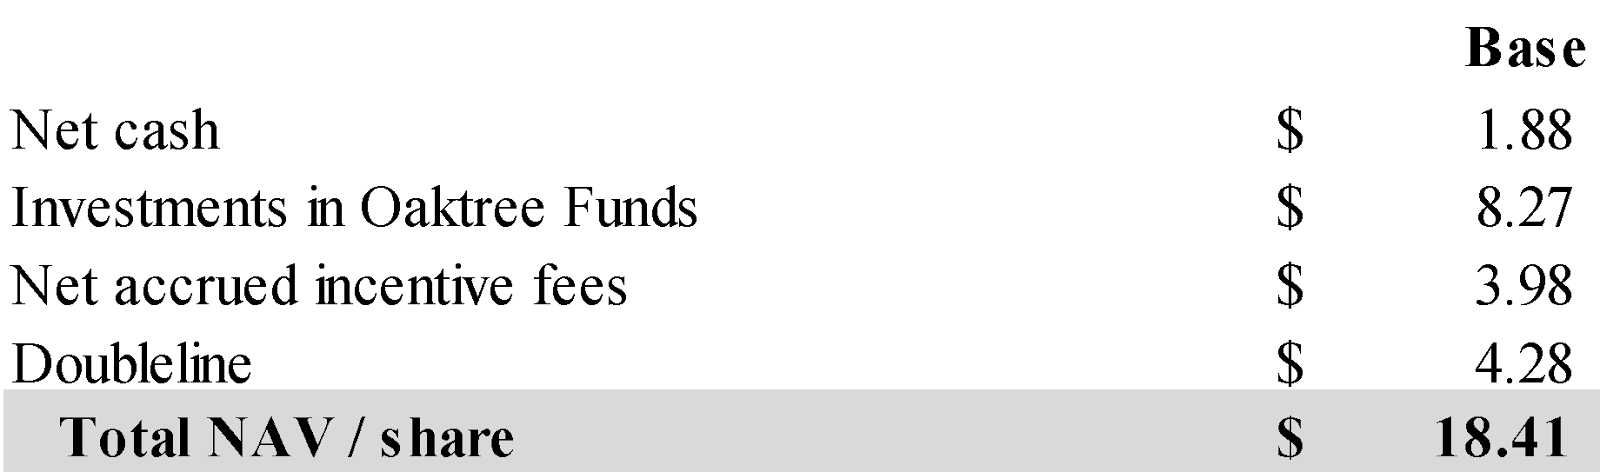
Part 1: Net Asset Value
1) Net cash

plus 2) Proprietary investments in funds (ex. Doubleline)

plus 3) Accrued incentive fees net of compensation

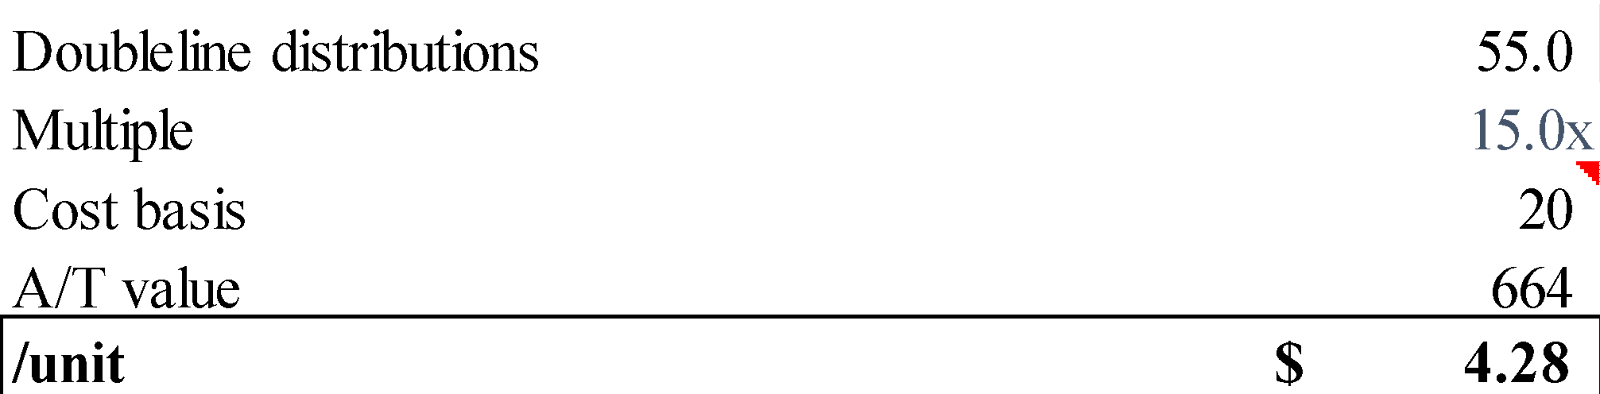
Plus 4) Doubleline
Oaktree’s 20% stake in Doubleline is accounted for under the equity method at $69mn, which grossly understating its true value. Doubleline is a traditional fixed income asset manager founded in 2009 by Jeffrey Gundlach,[1] TCW’s former Chief Investment Officer, and Philip Baruch, Managing Director of TCW’s mortgage group. Oaktree’s 20% stake in the firm is numerated at cost,[2] which, in light of Doubleline’s meteoric rise – benchmark-trouncing performance has fueled inflows that have boosted AUM from $16bn in 2011 to ~$100bn today – grossly underestimates its true value.
[1] Howard Marks supervised Gundlach and Baruch at TCW sometime in the mid-90s. The bitter recriminations and lawsuits between TCW and Gundlach that preceded the latter’s ouster from the firm have been covered with breathless intrigue. Gundlach’s whole prurient renegade thing (sex with co-workers, drugs, porn – you know, the usual workplace diversions) made him something of a folk hero amongst the Wall Street crowd and his off-the-cuff remarks on Apple’s stock price are treated with contemplative solemnity by some.
[2] plus income earned less distributions paid, per equity method accounting.
Equals 5) NAV / share
Part 2: Net Asset Value + FRE value
FRE requires some unpacking.
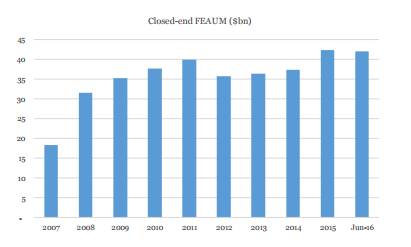
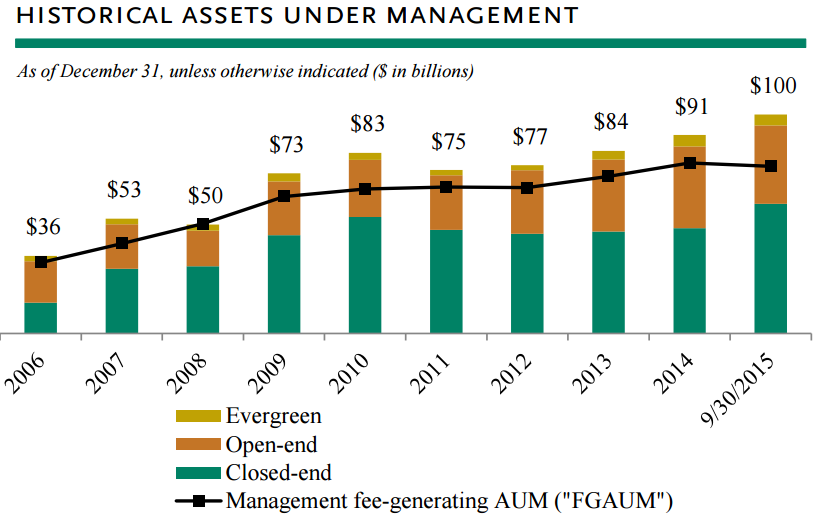
(1) A multi-year credit bull market has simultaneously presented abundant occasions to realize gains on the enormous 2008/2009 vintage funds while constraining attractive opportunities for capital deployment. Still, observe that even after significant returns of capital, FEAUM – and the management fees tied to it – have remained fairly steady as OAK has successfully replaced maturing legacy fund assets.[1]
[1] Once Oaktree has committed to investing 80% of the capital of a particular fund, it will typically start raising capital for a successor.
(2) Yet, OAK’s fee-related earnings and margins have declined from their 2010 peak as OAK has recently added to its cost structure ahead of shadow AUM deployment and FEAUM mix has shifted unfavorably toward lower-margin open-end funds.


(2a) Importantly, management fee rate compression is due solely to mix. Note management fee rates by fund category have remained stable.

[(2b – aside) Oaktree’s mix of open and closed-end funds yields natural self-correcting adjustments to overall management fees that somewhat decouple them from market performance and keep them reasonably stable. For instance, in cycle recovery, you might expect lower closed-end management fees as OAK returns more FEAUM than it raises in committed capital but higher open-end management fees tied to rising NAV, and vice versa in bad times. On the whole, because Oaktree raises closed-end capital chunkily and big raises coincide with market downturns and come with significantly higher fee rates, you should expect FRE to peak in years proximate to market disruptions.
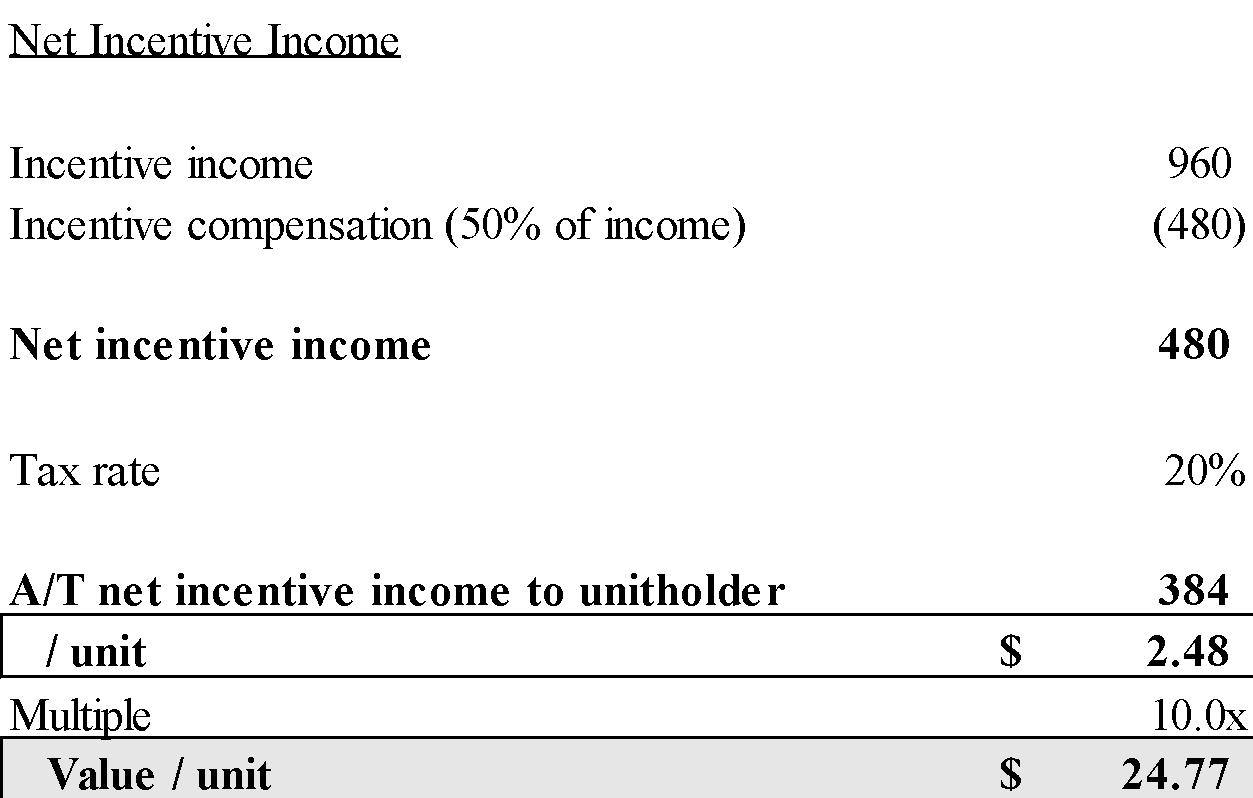
Notwithstanding the dampening impact of economic recovery on management fees, rising realized incentive and investment income is a significant offset that stabilizes distributable earnings.]
(3) While the shadow AUM fee rate of 1.3% is materially higher than the current blended average of 0.97% and will eventually result in loftier FRE margins, we should expect these margins to move peristaltically as closed-end FEAUM mix expands and contracts according to the opportunity set. Also, while $13bn of shadow AUM is sizeable, there are some caveats to consider.
Per “Closed-end FEAUM” chart above, we see that the last period of comparably-sized fundraising furnished a significant spike in FEAUM, which FEAUM has grown even as legacy investments have been sold. However, the impending investment opportunities this time around may not be so abundant and so the $13bn raised in the last 1.5 years may not be deployed as quickly or fully. And while chunkiest funds from 2008/2009 have been substantially distributed, we should expect some modest FEAUM headwinds from legacy funds rolling off.[1]
So let’s go halfway and just say $7bn in incremental FEAUM on top of the current $80bn and just assume mid-cycle blended fee rates and margins of 1% and 30%,[2] respectively, on current AUM to get:
[1] I calculate approximately $12.6bn of closed-end FEAUM whose investment periods have expired.
[2] FRE margins before stock-comp and interest have averaged ~38%+ over the last decade, but since 2010 the mix of FEAUM has skewed towards open-end funds, whose fee rates are 1/3 those of CEFs.
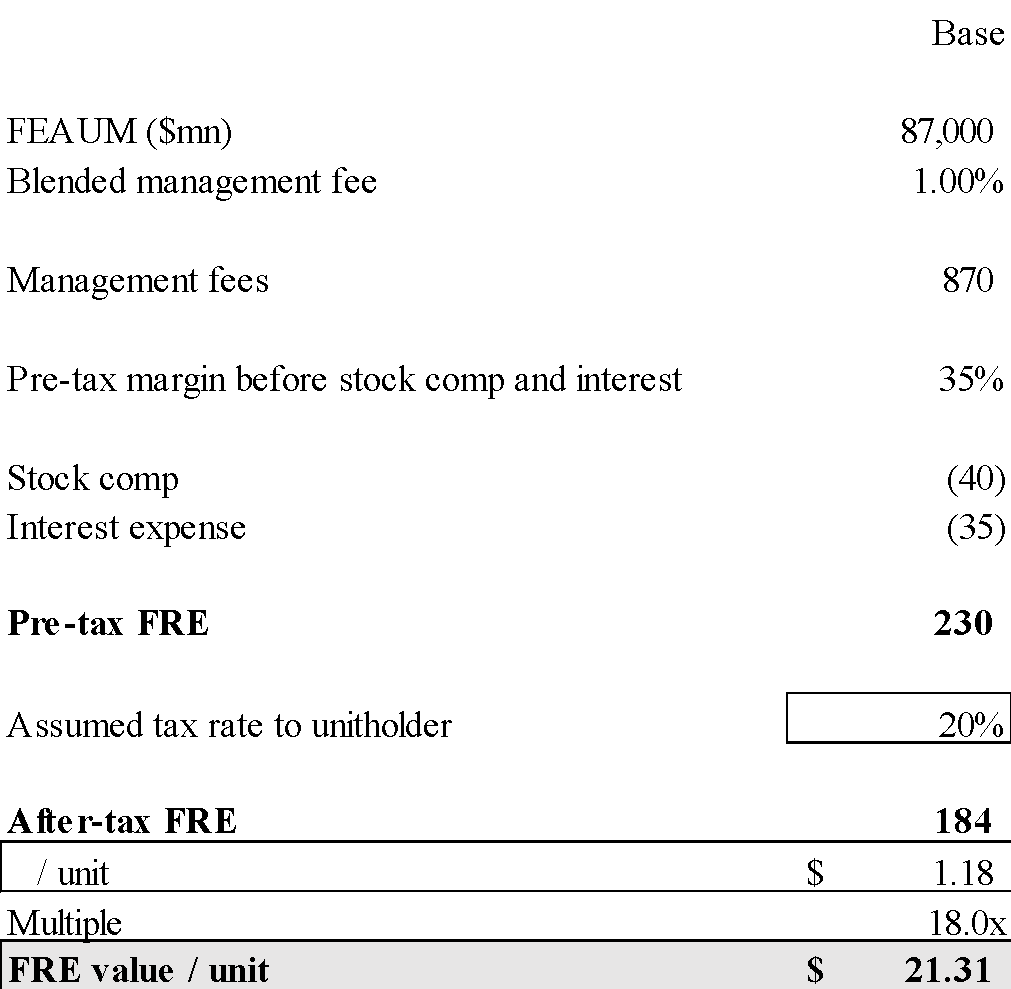
And finally, sum NAV and FRE value to arrive at:
Base Case: NAV ($18) [1] + FRE value ($21) = $39
Part 3: Net Asset Value + FRE value + future net incentive income[2] value
Future incentive fees confound value estimates because while ex-post, they may actually be the most important component,[3] ex-ante - given their dependence on future investment performance - who can say?
[1] To the extent Oaktree funds replicate their historical returns, marking proprietary investments at book value in a going-concern scenario is arguably too conservative.
[2] Oaktree’s performance fees are calculated as 20% of returns above an 8% preferred rate of return for closed-end capital in accordance to a standard fund distribution waterfall* and 20% of annual NAV increase, assuming high water mark thresholds are met, for evergreen funds. Roughly 45%-50% of incentive revenue is typically paid out as compensation. Oaktree recognizes incentive income only after all drawn capital plus the preferred return is returned to LPs and clawback risk is removed, a far more conservative recognition policy than assumed by peers.
*More precisely, according to OAK’s 2014 10-K: “Our closed-end funds generally provide that we receive incentive income only after our investors receive the return of all of their contributed capital plus an annual preferred return, typically 8%. Once this occurs, we generally receive as incentive income 80% of all distributions otherwise attributable to our investors, and those investors receive the remaining 20% until we have received, as incentive income, 20% of all such distributions in excess of the contributed capital from the inception of the fund. Thereafter, provided the preferred return continues to be met, all such future distributions attributable to our investors are distributed 80% to those investors and 20% to us as incentive income.”
[3] Particularly since they are linked to investment performance, which latter impacts future fundraising, which in turn, drives future management fees.
Reasonable people can assign value to incentive fees differently, but the sanest way for me to think about future net incentive fees is to observe that:
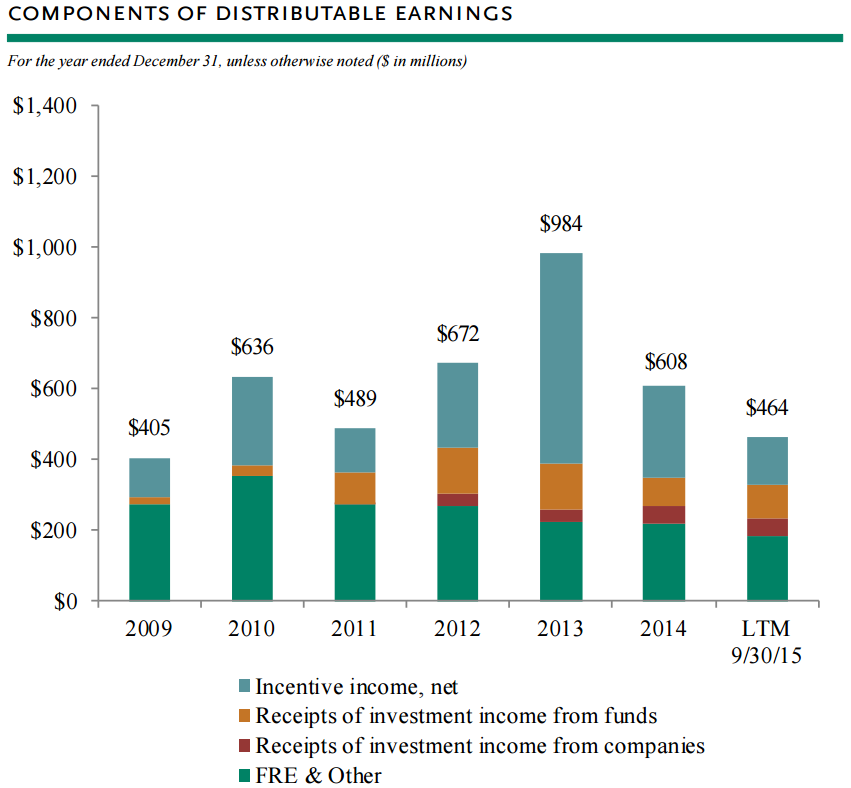
Cumulative realized incentive income since and including 2009 (when incentive-creating AUM step-functioned higher and plateaued) + current accrued incentive income = $3.3bn + $1.5bn = $4.8bn, which comes to around $650mn / year. During this time, incentive-creating AUM averaged about $35bn.
There’s presently $30bn in current incentive-creating AUM and if another $23bn of uncalled capital commitments become incentive eligible at some point, then we might expect incentive fees to reset to higher levels as well, all else equal. But, for conservatism, let’s assume future returns run lower than they have historically - offsetting incremental incentives from the AUM boost - and keep the $650mn as is. Then:
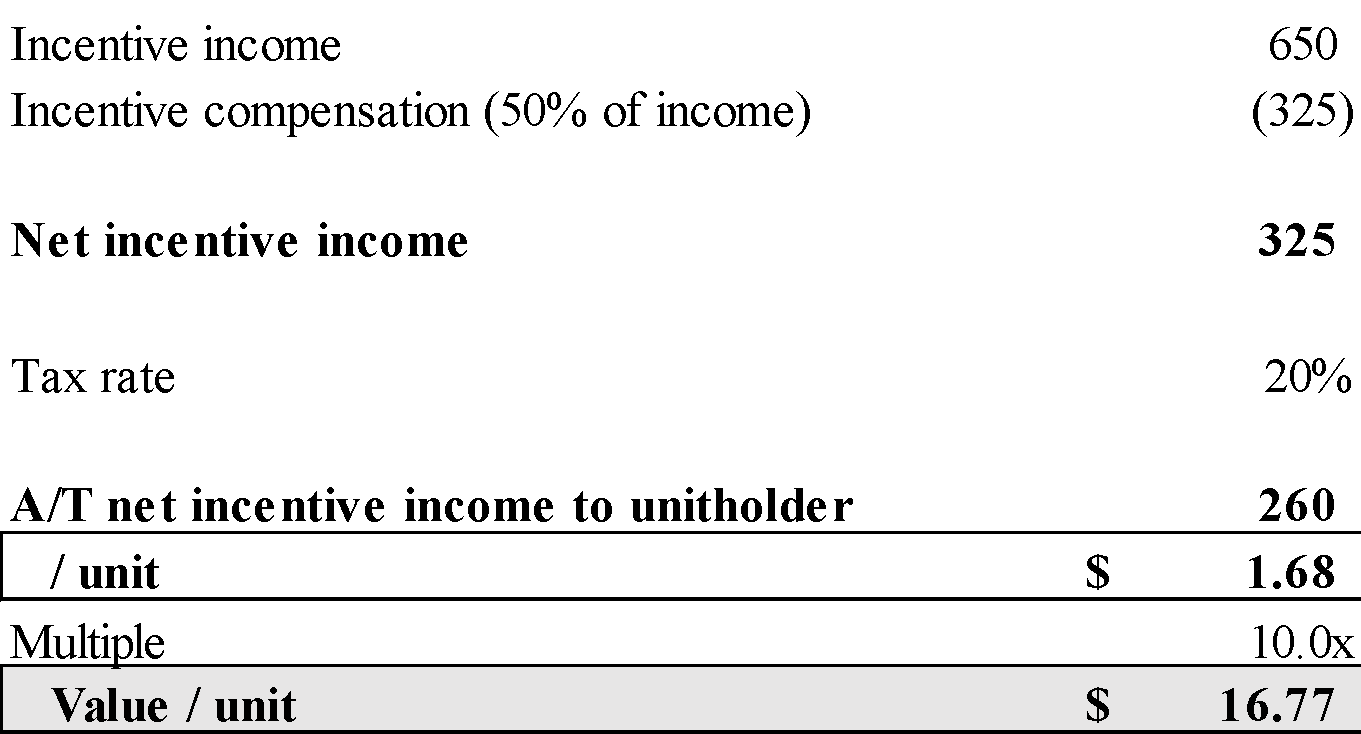
[Mathing it, a 12% forward return might translate into something like:
$40bn incentive AUM x 12% = $4.8bn gross profits x 20% = $960mn of incentive income, and
Then, base case: NAV ($18) + FRE value ($21) + A/T NII value ($17) = $56
Appendix
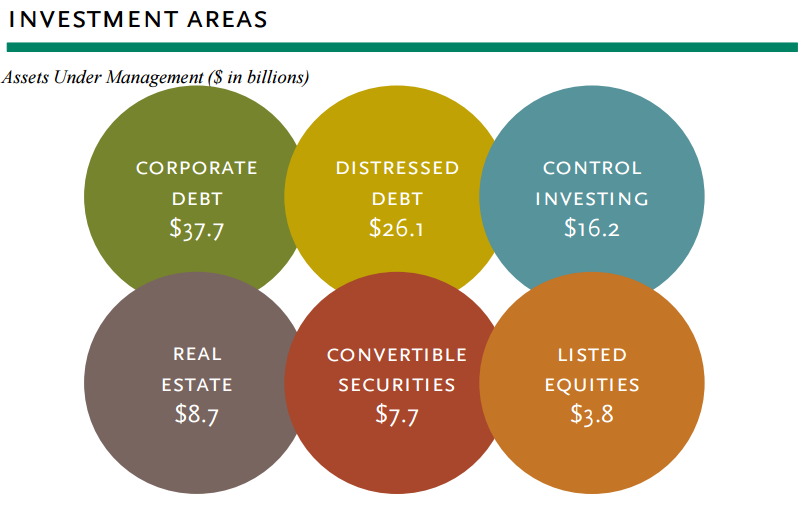
In 1q16, OAK adopted new consolidation guidelines and deconsolidated nearly all of its investment funds. Here is what sector exposure (debt + equity) looked like as of 12/31/2015:


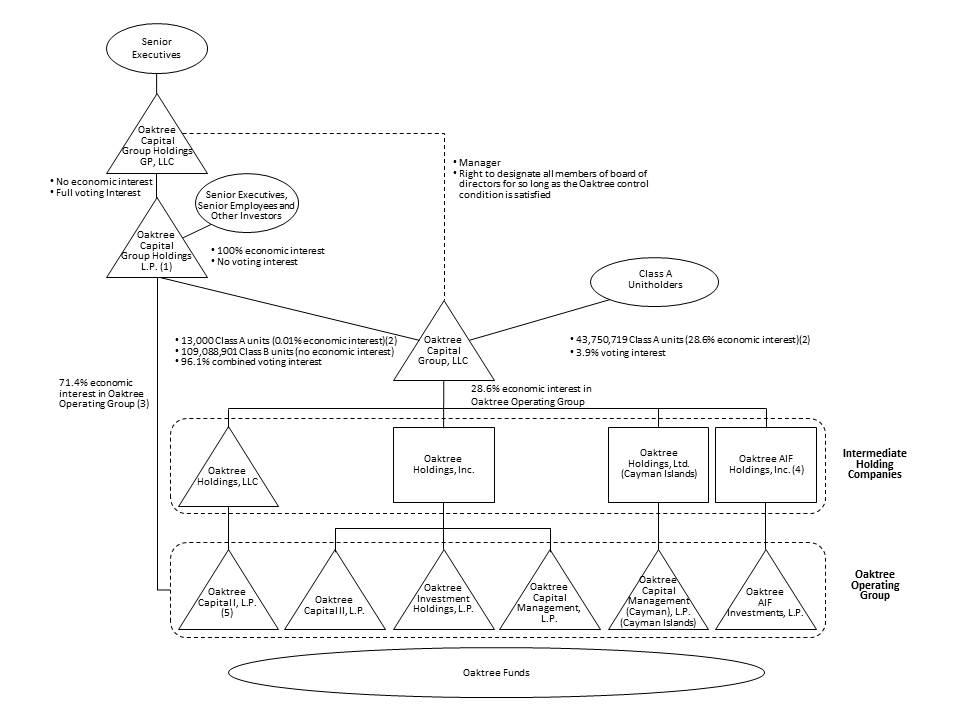
Organization Diagram
In 2004 and 2006, Oaktree offered ownership stakes to loyal clients, who acquired 13% of the Company. In May 2007, concurrent with a 23mn Class A unit private offering to institutional investors, the owners of Oaktree exchanged their interests for units in OCGH, which were exchangeable for Class A units (the units available for us to own). For five years, these Class A units traded (thinly) on a private over-the-counter market developed by Goldman Sachs, allowing insiders to monetize their ownership stakes. In April 2012, Oaktree and some insiders offered A-units to the public in an IPO. Since then, more class A units have been issued and exchanged for OCGH units owned by insiders, and as a result the economic ownership held by Class A unitholders has increased from 20% at the time of the IPO to 32.2% today.
Oaktree Operating Group earns management, performance, and incentive fees for managing LP capital and, after deducting expenses, passes the profit up to Oaktree Capital Group Holdings and Oaktree Capital Group. OCG, in addition to collecting its share of the OOG profits, earns some investment income from principal investments in OOG’s funds. [1]
[1] The minimum proportion of principal investments in closed-end and evergreen funds has increased from 1% in 1998 to 2% in mid-2004, to 2.5% up to $20mn in 2007 (subsequent to the 2007 Private Offering). In 2009, the maximum dollar limit increased to $100mn.
Evergreen funds, like open-end funds, accept capital on an ongoing basis and do not distribute funds from realized investments, though unlike open-end funds, they earn incentive fees (tied to high-water marked NAV), significantly higher management fees and require 1-3 year lock-up periods. The largest strategy within Evergreen is Strategic Credit, which provides rescue financings for distressed companies and invests in high yield and Sr. loans with greater than average credit risk.
AUM and FEAUM have tiled towards lower-fee open-end funds over time
Corporate debt, while the largest AUM sub-category, resides mostly in open-end funds that earn no incentive fees and whose management fee rates are a fraction of those offered by closed-end funds. Within the high yield sub-sub-category, OAK is concentrated in the higher quality > CCC layers.
In 2013/2014, the Firm’s closed-end funds have been particularly focused on Europe, real estate and infrastructure.
I and/or others I advise do not hold a material investment in the issuer's securities.
Catalyst
None.
| show sort by |