| 2017 | 2018 | ||||||
| Price: | 36.38 | EPS | 4.29 | 5.79 | |||
| Shares Out. (in M): | 6 | P/E | 8.5 | 6.3 | |||
| Market Cap (in $M): | 260 | P/FCF | 11.8% | 15.9% | |||
| Net Debt (in $M): | 56 | EBIT | 40 | 52 | |||
| TEV (in $M): | 315 | TEV/EBIT | 6.7 | 5.2 | |||
Sign up for free guest access to view investment idea with a 45 days delay.
- Commercial Real Estate (CRE)
- Convertible Bond
- Highly Cash Generative
- Germany
- Elliott Management
- Management Ownership
- Misunderstood Business Model
- Founder Operator
- Undervalued Bond
Description
Publity AG Convertible: Downside Protected Call Option on a High Potential Upside Asset
Thesis: Long the 2020 convert of Publity AG
Publity AG (Publity) is a fast growing real estate asset management business focused on German offices. Whilst on recent performance it has excellent upside prospects one can not ignore potential downside risks to the business. However, we think at a price of 101% the 3.50% 2020 convertible bond of Publity AG (ISIN: DE000A169GM5, issue size € 50m) is an excellent investment as it provides similar upside to the common stock with virtually no downside risks given strong asset protection. The market seems to ignore both the strong credit profile of the convert and the potential upside of this business.
Using Publity’s 180 day historical volatility, to value the embedded option we get to an implied yield of ca. 9.5% which is far too high for the robust credit profile. One can argue that the 180 day volatility (at 23%) underestimates the fundamental variation in expected outcomes over the next 3 years.
This is also one of two European stocks that Renaissance Technologies is short (source: Bloomberg SPOS ), we believe they picked up on the mispriced optionality and are delta hedging this convert.
Given our fundamental view we believe an outright long is the better trade and compute several scenarios where the IRR can range between 3.2% to 42% over a period of 3 years.
Short history and the importance of Elliott to the recent AUM trajectory
Before 2014: the ‘pre-Elliott period’ - ca. € 160m AUM
The company was founded in 1999 by several landesbanken as an IPO issuance house. During this period it IPO'd several companies of which the most successful have been Infineon AG and Deutsche Börse AG. Since the 2001 it evolved to provide management and consulting services to distressed companies, especially with respect to negotiations with lending banks. Here it picked up some basic non-performing loan (NPL) experience. In 2004 Publity started to concentrate on the acquisition and servicing of large-volume credit claims. This activity was subsequently developed into an investment product that was placed privately with institutions and retail funds.
In 2013, Publity transformed its fund business by moving away from NPLs to distressed properties and becoming AIFMD compliant, with their first compliant fund bringing their AUM to ca. € 160m at the end of 2013.
After 2014: the ‘Elliott period’ - ca. € 3.8bn AUM, total of € 7bn AUM guidance to end of 2018
In 2014 Elliott (Elliott International L.P. and Elliott Associates L.P. specifically) provided Publity with its first large institutional mandate to buy NPLs or distressed german offices out of foreclosures. This is quickly followed by another Elliott mandate that brought the total to ca. € 1bn. As part of the deal Elliott required a co-investment from Publity of up to 3% for the mandate. In order to cover this € 30m commitment Publity decided to list its stock in 2015 and subsequently issued a € 30m convertible referenced to the stock.
With the seal of approval from Elliott, other asset management mandates followed and we understand a number of insurance companies and other institutions have invested. The convert was upsized to € 50m in the first half of 2017, to cover for more co-investments requirements. At the end of June 2017 the AUM stood at € 3.8bn, up from 3.2bn at the end of 2016 and with firm commitments facilitating € 7.0bn at the end of 2018. It is clear the majority of future revenues and growth will be derived from the institutional management of stressed german office real estate. The company expects to internally generate any funds required for co-investments going forward.
Market overview, business and strategy description
We believe that in recent times NPLs have gone from being “under” risk weighted to being structurally “over” risk weighted from a bank regulatory capital perspective. This creates a propensity for banks to sell NPLs below economic value in a drive to shore up capital ratios and this in turn creates value opportunities for distressed buyers.
German banks are still sitting on large amounts of GFC created NPLs and associated collateral. Their collective size has been estimated to be at around € 67bn (see: link) at the end of 2016. Banks count for roughly 50% of the Publity pipeline, the other 50% is sourced from funds and asset/mortgage backed securities. Publity claims to have identified 1,218 target assets with a value of ca. € 26bn across these channels (source).
Instead of participating in auctions or using intermediaries, Publity seeks out opportunities themselves and looks to bid on assets with the least amount of competition. Publity also differentiates itself through their highly standardised investment process that has been refined over time. Bid submission is fast and followed by a standardised due diligence process. If all is in good order the time to completion is kept short by using a trusted team of professionals to execute transactions. This allows Publity to evaluate more than a thousand assets per year. This is why the CEO describes the company as a “contract factory” rather than a real estate company (“Publity sieht sich nämlich nicht als Immobilienkonzern, sondern eher als Verträgsfabrik” ).

The typical property will be located in one of the top 10 German cities, will have been neglected as tenants defaulted and feature a low occupancy rate, all this combined with a limited investment requirement to bring the building back in good order. After the acquisition of a property the strategy is to “manage to core” - which means to provide some essential upgrades, increase occupancy rates and increase the length of leases.
Publity's track record on the “manage to core” strategy is nothing less than impressive. Publity numbers properties it invests in sequentially starting with 1 and it currently is at number 594 at the time of this writing (source). On the first 530, which have all been sold, their average equity return since inception has been 27% with an average holding period of 16 months (source) - which equates roughly to 20% per year. This performance has obviously been aided by record low interest rates that allow for plenty availability of re- and exit financing.
Total employees at Publity stood at 26 people at the end of 2016 with AUM at € 3.2bn which is actually less than the 28 people at the end of 2014 when AUM stood at € 500m. This indicates there is significant operational leverage inherent to the business. Thomas Olek, the CEO, owns the majority of shares at 49%, with management in total owning more than 50%.
Segments and key profit drivers
It’s difficult to get a handle on Publity given that revenue is coming in from different sources and is sometimes still in the early stages of ramping up. In this section we describe the key profit drivers per segment through which we think we can break down and assess this risk.
Retail: € 100m AUM and legal risk
Revenues are derived from management fees of NPL and distressed property funds that are sold to retail investors. The strategy is the same as the institutional segment but the property sizes are smaller at € 5-10m. Typically there are high upfront fees of around 3% and running fees of around 2%.
Given the small AUM of this business relative to the institutional business we don’t believe the operational performance of this segment is material to the overall performance of Publity - hence we put the revenue in run-off in accordance with the legal terms of the funds across all of our scenarios. For modelling purposes we lump the value of this business together with the institutional segment.
The past reliance on distributor networks has carried forward some legal risk in the form of a civil claim. This has been disclosed in the listing prospectus (page 28, link). The plaintiff claims that Publity entered into an verbal distribution agreement in 2009 with respect to the NPL retail funds. Publity believes that an agreement to this effect has never been established and sees reasonable prospects for a successful defense.
Although the claim amount is quite large at ca. € 30m (€ 36m with statutory interest), based on the answers we got from IR and our own checks, we believe the risk related to this claim is remote. Not only do the grounds of the claim appear to be extremely weak, the plaintiff himself has a somewhat questionable background to say the least. More information will become available when a preliminary hearing will take place in the Leipzig court on the 14th of November 2017. Management expects the case to be thrown out at this hearing.
NPL Servicing: € 3.2bn of nominal
Publity works out NPL balances for third parties under bilateral agreements. The nominal balance of this business is not counted into the end of June 2017 € 3.8bn AUM number as the workout typically only generates a recovery of 5-10% of nominal. The fee structure here is simple: Publity gets 22% of everything that they squeeze out of the remaining balance. The typical work out period is 5 years and the key valuation driver here is the recovery rate. Our research shows that the typical recovery ranges between 6-8% and is correlated to general economic conditions. For our low, mid and high scenarios we will use recoveries of 4%, 6% and 8% and we will assume equal amounts are received over the remaining periods of the contracts.
Institutional: € 3.7bn AUM
This is the main segment as described above. It targets property sizes between € 30-100m. At the end of June 2017 the capital deployed in this segment stood at ca. € 3.7bn with guidance for € 5.1bn by the end of 2017 and € 6.9bn at the end of 2018. We have confirmed with IR that these are committed funds by several parties and given the accuracy of past guidance we see little risk to this deployment schedule, which we reflect fully across all our scenarios.
The revenue structure is roughly consistent across all mandates, with 3 fee streams:
-
annual fee on average deployed AUM 0.5%
-
upfront finders fee upon deployment 1.0%
-
performance fee above a certain hurdle rate 20%, hurdle = 8-10% IRR
The annual fee is the most simple to model as under whatever AUM scenario we define we will take the average AUM balance and charge accordingly. Please note that the AUM fee can differ in some mandates but that we model an average at 0.5%.
The initial finders fee is also easy to model given the deployment guidance. However, given the short 16 month historical turnaround time of Publity’s workouts and the typical mandate ranging from 5 to 7 years there is a strong possibility that capital will be deployed more than once. One could easily see that deployment can take place 2 to 4 times leading to additional finders fees. Redeployment is subject to investor approval, so there is a possibility that if market circumstances turn redeployment might be stopped at some point, resulting in a run-off scenario instead. We observe that the key profit driver here is the number of times that AUM is redeployed. We will apply a run-off, a 1x redeployment and an ongoing business scenario with a capital recycle period of 2 years in the latter two scenarios.
Finally, the performance fee is the most difficult to model as it’s the most dynamic. As per the finders fee, it is dependent on the turnround time per property and on the number of times that capital is redeployed but also on the return per object. The main key driver here will be the annual return per object - which we define for our low, mid and high cases as 9%, 12% and 15% - which we believe is conservative given the 20% p.a. track record. We fix the hurdle rate across all mandates at 9% for simplicity.
Intermezzo: some estimated realised Elliott fee numbers
Through our proprietary research we have been able to estimate some actual fee numbers on the Elliott mandate. Each property has a JV vehicle in Luxembourg for which one can retrieve delayed accounts. In this manner we can see the deployment of ca. € 580m of cash by the end of 2015.
Interestingly, we can also see the prices of the first properties that have been sold and based on some assumptions (see Appendix A) we can compute the resultant fee metrics:
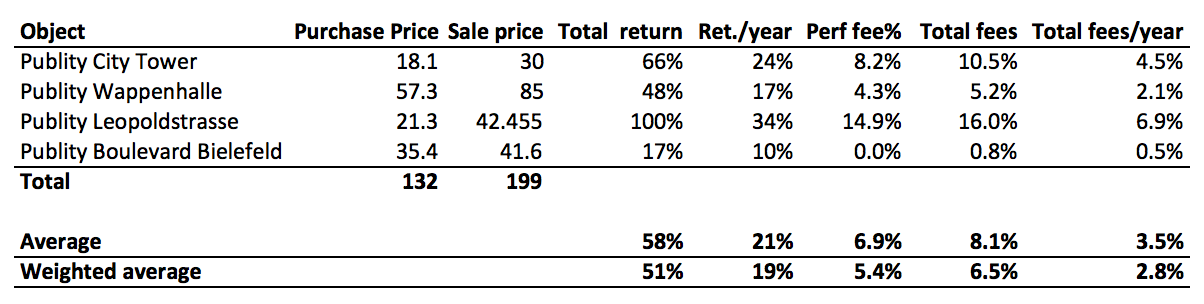
Estimated realised Elliott fees, €m
As can be seen, the first couple of transactions have been in line with management’s numbers - with the annualised return numbers around the 20% track record. Performance fees are lumpy as expected, ranging from 0.8% to 15.8% of the purchase price.
Co-investments
The co-investments that Publity is obliged to make form the majority of the tangible assets on the balance sheet. The ultimate valuation here will be made dependent on annual return per object and the term over which we see the co-investments come back. We assume 2 years for the term with the 9%, 12% and 15% low, mid and high case annual return per object. We assume no profits from further redeployments for conservatism.
Consus Commercial Property AG: not included for now
Consus is a listed vehicle controlled by the CEO of Publity. It was established to hold development assets outside the Publity group structure which were deemed to be too complex to be held within Publity.
Currently there is a reverse merger pending after which the majority of Consus shares will go to CG Gruppe which is a well established real estate developer (see link). The AUM of Consus will exclusively be managed by Publity (see link), generating a 0.5% AUM fee. Given the novelty of this transaction and the pending consummation of the reverse merger we exclude this from our calculations but it can clearly provide further upside to our thesis.
Credit scenario
Now the fee structure has been carved out we can define some scenarios. Given its a convert we start with a liquidation scenario, the table below calculates coverage assuming a near term default:
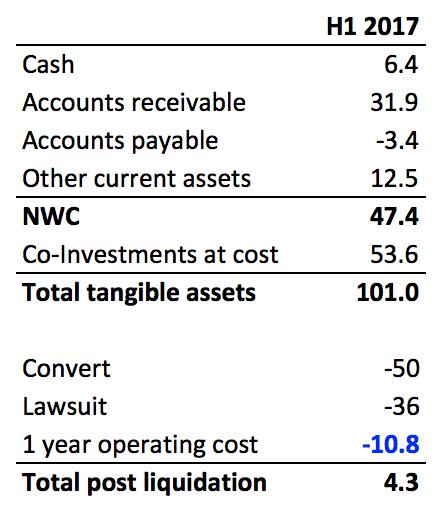
Liquidation scenario, €m
As can be seen, the convert is strongly covered, even after fully adjusting for the remote litigation risk (with estimated interest) and 1 year of operating costs in a liquidation scenario.
Even in the unlikely case where all excess cash is paid to the equity holders the convert coverage will only increase over time as minimum capital reserve rules will limit payouts while the lawsuit will be resolved one way or another.
Run-off scenarios
With liquidation out of the way we proceed with more realistic run-off scenarios where we assume a decreasing fee stream until each mandate runs out, subject to a redeployment assumption:
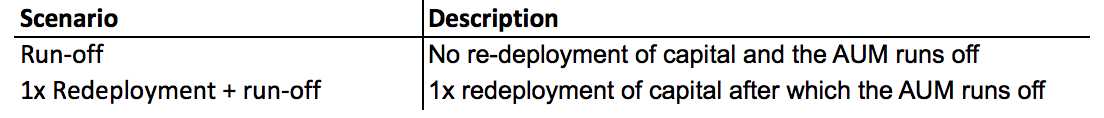
AUM Run-off scenarios
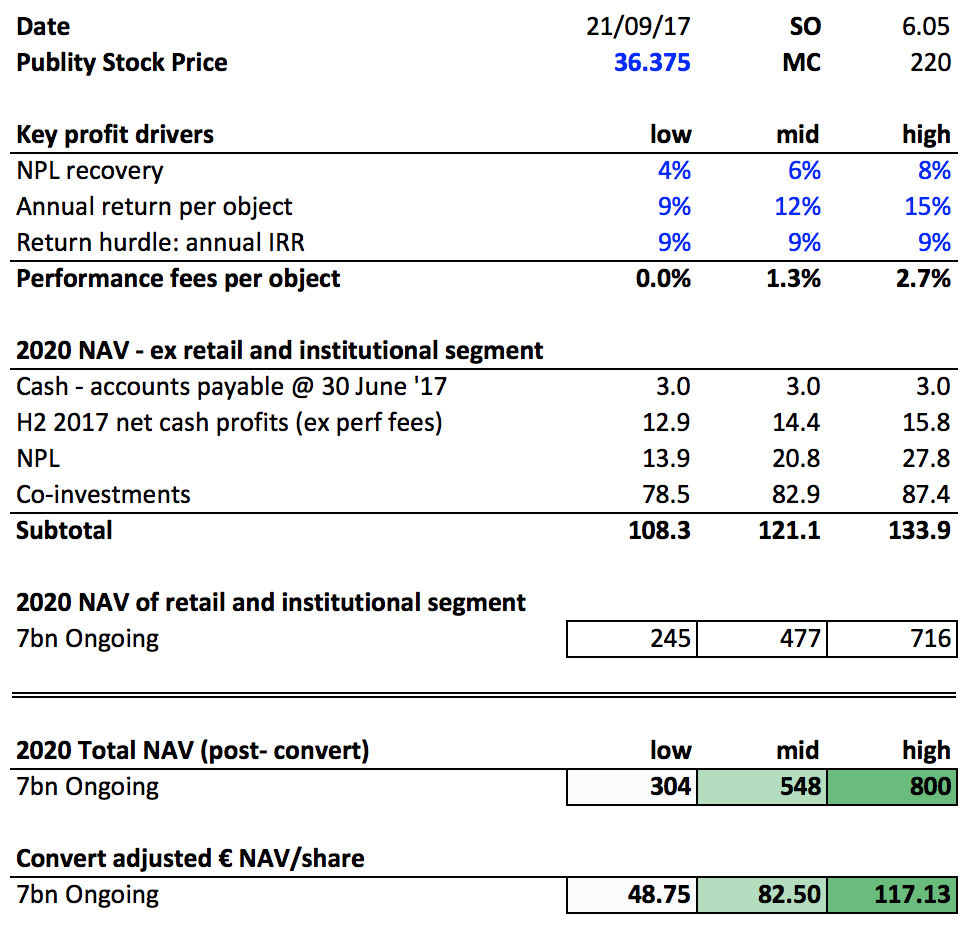
The resulting AUM profiles look as per the graph below. The 1x redeployment scenario gives an AUM bump for 2 additional years and then retreats in the same run-off.
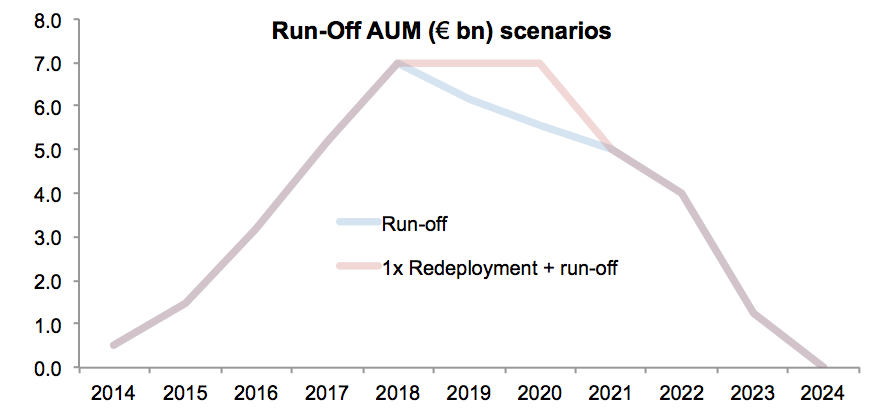
AUM Run-off Scenarios
In order to assess the return and coverage of the convert we run the business forward to the convert’s maturity (end of 2020) and assess the forward NAV available for the shares and the convertible bonds at that point in time. We define different AUM and key profit driver scenarios, detailed assumptions can be found in Appendix B.
The table below shows the results. As can be seen, the convert has quite a comfortable equity cushion in the run-off scenarios. Given that the current conversion strike is € 41.58 there is some significant upside in a number of scenarios.
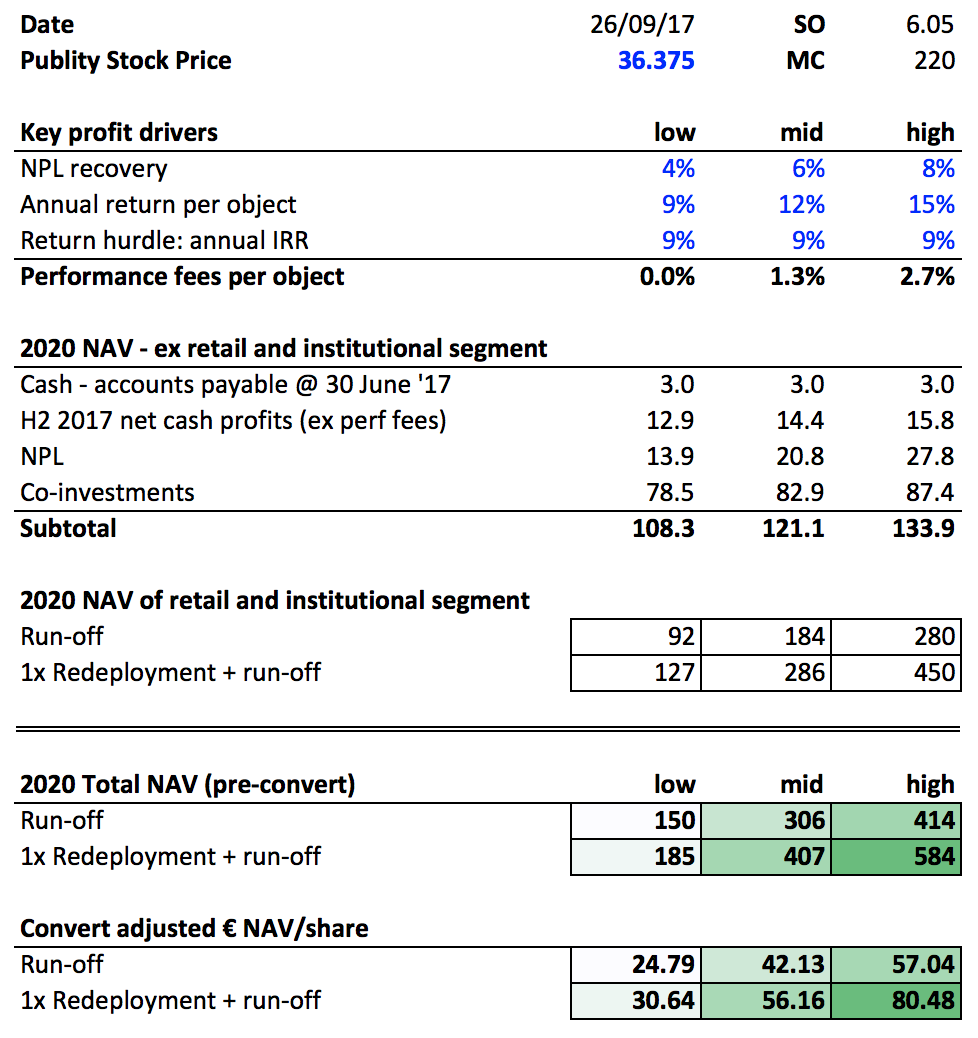
Run-off scenarios, €m
Ongoing business scenarios
The remaining question is what this business could be worth on an ongoing basis. We define a scenario where the AUM stays at € 7bn from 2018 onwards and basically recycles itself every 2 years. The resulting AUM profile for this scenarios look as follows:
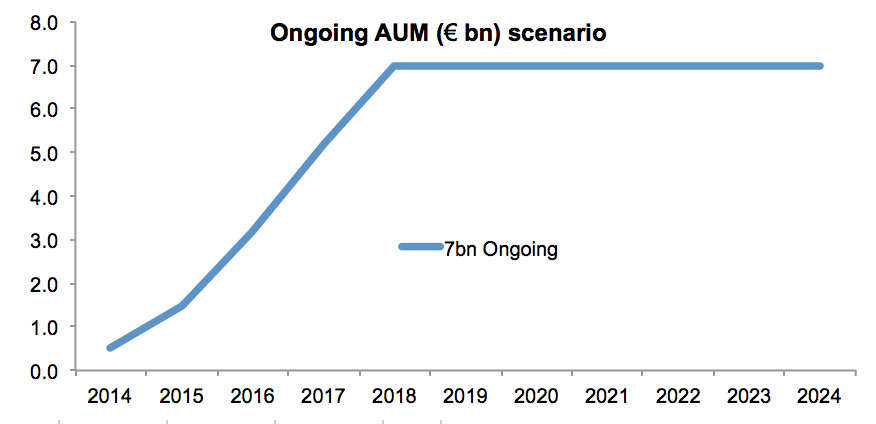
AUM € 7bn Ongoing scenario
The ongoing business scenario requires some additional assumptions. The main assumption is that the full AUM is recycled within a time frame of 2 years, which is conservative compared to the current track record of 16 months. When we get to 2020 we need to value the continuing business on a multiple of the profit stream. In this case we look at PE comps and use a very undemanding 6x multiple for the recurring profit stream and a similarly undemanding 3x multiple for the performance profit stream. We detail further assumptions in Appendix B.
€ 7bn Ongoing scenario, €m
As we look at the 2020 NAV per share (after dilution of the convert), we see share prices well in excess of the convert strike - which implies that significant upside is available in the ongoing AUM scenario.
Putting it all together: the convert and its IRR, Black & Scholes and explaining the cheapness
Now we have defined all the scenarios we will run them through the convert to get to IRR numbers. They key features of the convert are as follows:
-
ISIN DE000A169GM5
-
Outstanding notional € 50m
-
Maturity 17 November 2020
-
Strike € 41.58
-
Exercise From the 1st of October 2016, daily
-
Credit enhancement Negative Pledge but bank loans are allowed
-
Anti-dilution features Dividend, Subscription Right, Capital Increase,
Merger, Other Reorganization
We take the pre-convert NAV in 2020 and rationally either exercise the convert at maturity or not. This provides us with a convert adjusted NAV per share from which we can compute the IRR of the convert. We assume the purchase price as of the date of this article at 101%. Please refer to Appendix B for additional assumptions.
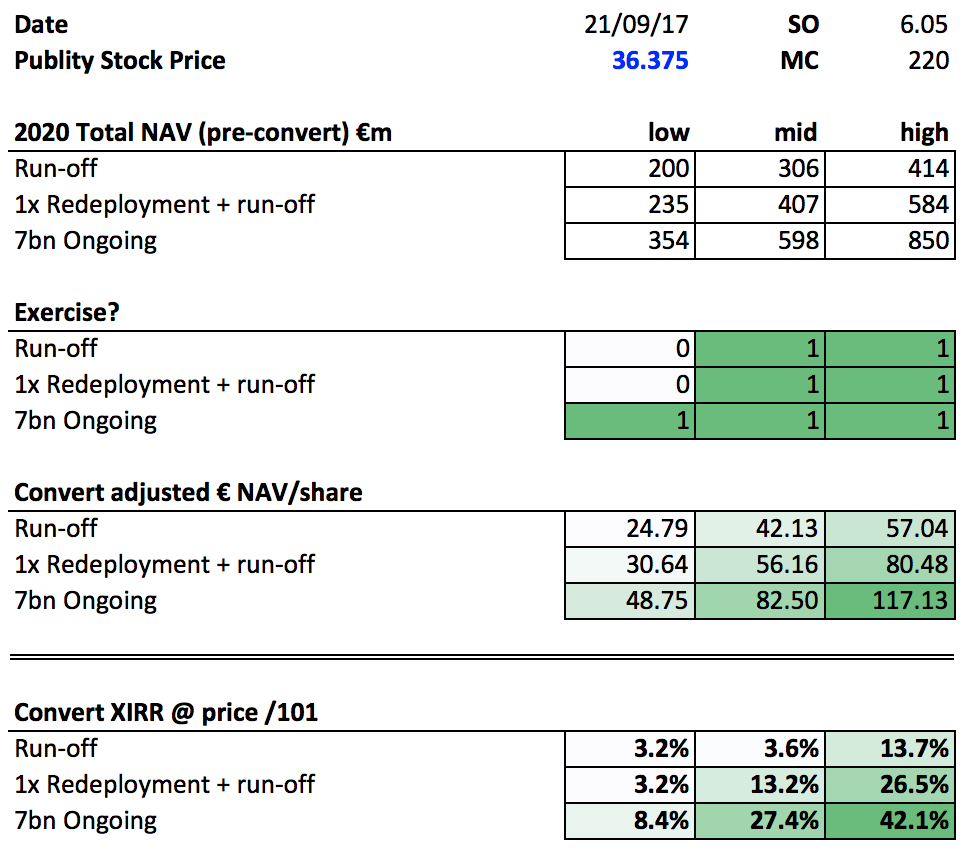
Convert IRR across all scenarios, otherwise €m
As can be seen, the convert provides IRRs in a range of 3.2% to 42%. The reader can weigh those returns to taste. We would like to note that we do not consider the low return scenarios to be highly probable. In the case of the run-off scenarios the investments are sufficiently near term to discount low return scenarios. We consider a low return ongoing scenario unlikely as we do not believe the business would continue in the case of extremely low returns.
Valuing the call option based on historical volatility
We can also illustrate the cheapness of the convert through valuing the call option based on historical observed volatility of Publity common stock. If we take the 180 day historical vol at 23.25% and impute this into the Bloomberg OVCV solver we get an implied credit spread of ca 950 bps.
This we believe is too high for a company that has a business with ample cash flow visibility and tangible assets to cover the redemption of the convert in 2020. Apart from the fact that a thorough analysis of Publity has shown a significant upside potential that is very likely undervalued by the 23.25% historical volatility.
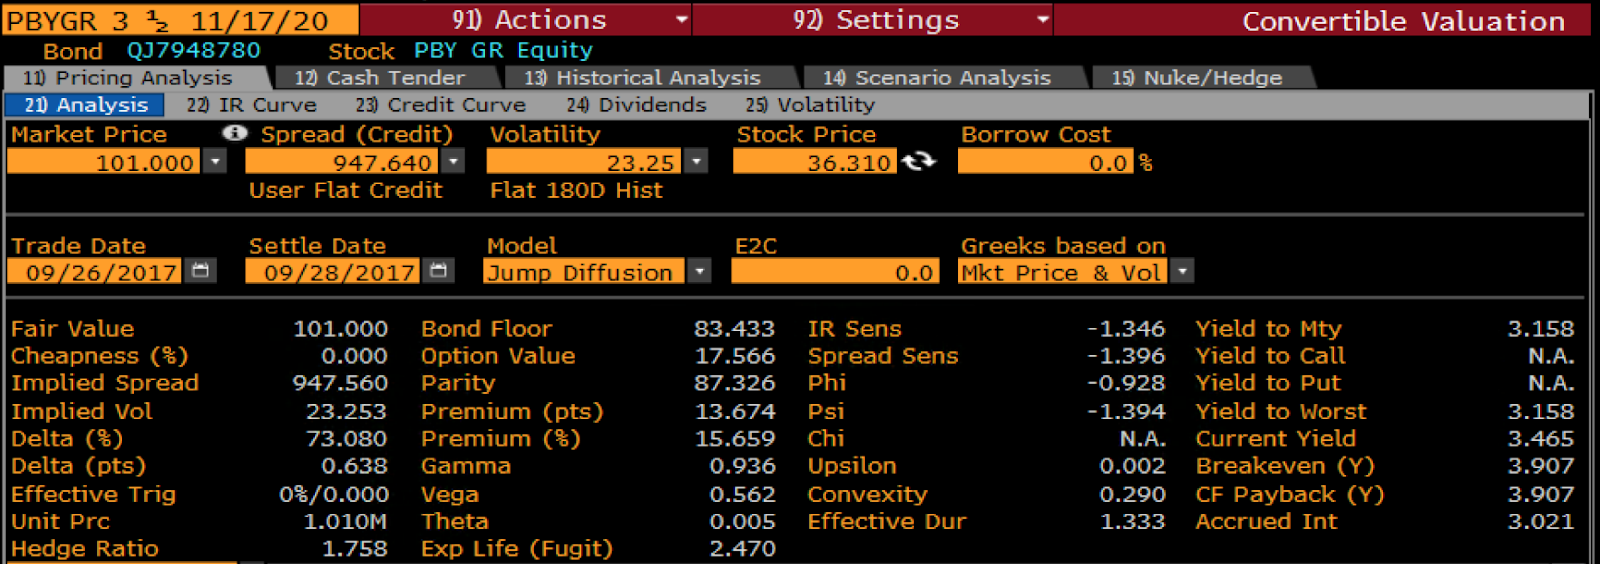
Bloomberg Implied Credit Spread Valuation through OVCV
Why cheap?
-
The fact that Elliott is involved with Publity has never been officially/publicly announced but can be ascertained through delayed filings of the underlying HoldCo and ObjectCo companies
-
The market does not want to extrapolate recent growth and is not able to ascertain the (relatively) recurring nature of revenue going forward based on past results
-
Revenue and cash flows are coming from multiple sources and hence are difficult to get a handle on without putting in extra effort
-
The accounts of Publity are in German with some documents translated into English
-
Revenue and cash flows are lumpy and also exhibit seasonality. Some seasonality will be contractual - we understood that performance fees are paid in H2 - and others are inherent to the business, i.e. banks typically “window-dress” their capital numbers at the end of the year, which results in higher NPL based transaction volumes in H2
-
Publity has been through a dynamic past and the portion that relates to the retail segment can be perceived as a low quality business with a lot of reputational risk. This muddles the view on the much higher quality, emerging international AUM business
-
Through our conversations with IR we have understood that the CEO, Thomas Olek, typically provides conservative guidance as he wants to lower the possibility of adjustments downwards
Conclusion
Taking the minimal credit risk into account this convert is substantially mispriced. Additionally, given the committed AUM we believe the Publity stock has substantial risk to the upside in the medium term so we choose not to hedge the convertible and are holding this as an outright long.
Risks
-
Macro: German economy, higher interest rate, availability of funding
-
Increased competition, depletion of available discount
-
Tax environment for properties in Germany
-
Loosening of bank capital risk weights for NPLs
-
Publity is listed as an OTC stock and ot subject to notification requirements of the Securities Trading Act in germany
Appendix A: assumptions for the estimated realised Elliott fee numbers
-
The accounts evaluated had balance sheet dates of 31 December or 30 June 2015.
-
The way we have observed that the Elliott JV works is that funds are dropped down from the TopCo (Publity Real Estate Opportunity Services S.à.r.l.) to an ObjectCo by way of interest bearing loans as new objects are found. So TopCo holds loans against all objects.
-
For the basis of our purchase price estimate of each object we take average of the balance sheet asset value at ObjectCo and the size of the relevant interest bearing loan size at TopCo. We do this as we believe that cash is dropped down as well for working capital purposes, however net rent receipts could offset this.
-
We disregard any rents that might be received and assume they match the expenses (including capex) made and work solely of the balance sheet numbers. We think this is a fair assumption that is conservative on balance. In reality though net rents should be added to the total return calculations and feed through the performance fee calculation, especially over longer holding periods.
-
For the sale prices we have been generously provided for by the following statement in the TopCo accounts:
“At the beginning of 2017 the company sold the assets held in Publity Wappenhalle (EUR 85,000,000.00), Publity City Tower (EUR 30,000,000.00), Publity Leopoldstrasse (EUR 42,455,215.00) and through a share deal the subsidiary Publity Boulevard S.à.r.l (EUR 41,600,000.00).”
-
In order to estimate the time elapsed between drawdown and sale we take the establishment of the underlying ObjectCo and add 6 months to it to allow for formalities and interpret the “At the beginning of 2017...” as per previous bullet point as being the 15th of March 2017 (the account itself was filed on the 19th of May 2017, referring to a balance sheet date of 30 June 2015). This feeds into the annual return calculations and in turn the performance fees.
-
To estimate performance fees we use an annual hurdle rate of 10% with a 20% carried interest. Subsequently, we apply the purchase price, sale price and time elapsed all as discussed above.
-
To compute the total fees we add any observable non-performance fees to the estimated performance fees. We note here that due to timing differences the non-performance fees used might underestimate the non-performance fees actually received.
Appendix B: scenario model assumptions
-
Evaluate the intrinsic value of the business as a SOTP at the end of 2020:
-
Run all cash flows forward to the end of 2020 without accrual, starting from 2018
-
Any cash flows thereafter, are either:
-
discounted with a discount factor of 16.7%,
-
multiplied with a factor of 6x (consistent with discount factor) if recurring, or
-
are multiplied with a factor of 3x if performance fee based.
-
Operating costs:
-
€ 9m/year is assumed in the peak/ongoing AUM scenarios, given that FY 2016 was at that level and included the legal and one-off costs for the convert issuance (similar for H1 2017)
-
For AUM scenarios that run-off the operating costs are adjusted downwards on a pro-rata basis with a minimum of € 1m
-
Effective tax rate: 33%
-
Cash: roll forward to end of 2018
-
The payables outstanding at 30 June 2017 at € 3.4m are deduced from cash
-
We disregard any receivables as they are included in future revenue through our AUM scenarios
-
H2 2017 net cash profits
-
We assume the guidance of € 5.2bn AUM at the end of 2017 and apply no performance fees to get to a FCF of € 10.1m
-
We also include normalised NPL segment revenues based on the relevant recovery scenario applied
-
NPL
-
The value of the NPL business varies across the NPL recovery scenario with the assumption of discounting as discussed above
-
Co-investments
-
We assume that co-investments are accruing for 2 years at the relevant “annual return per object”
-
For the cost price we assume the H2 2017 balance sheet value plus the “other current assets” for a total of: € 66.1m
-
We don’t assume any profits or accrual post an initial 2 year period, even though in redeployment or co-investment scenarios additional co-investment profits might be generated
I and/or others I advise hold a material investment in the issuer's securities.
Catalyst
-
AUM develops as per guidance
-
Announcement of additional AUM mandates
-
We predict profitability ex-performance fee of around €30-35m in 2018 - this implies a pro-forma P/E ratio of 6.3-7.3x.
| show sort by |