| 2016 | 2017 | ||||||
| Price: | 10.40 | EPS | 1.11 | 1.28 | |||
| Shares Out. (in M): | 27 | P/E | 9.4 | 8.125 | |||
| Market Cap (in $M): | 285 | P/FCF | 4.2 | 4.2 | |||
| Net Debt (in $M): | 556 | EBIT | 85 | 90 | |||
| TEV (in $M): | 840 | TEV/EBIT | 9.9 | 9.4 | |||
Sign up for free guest access to view investment idea with a 45 days delay.
Description
Townsquare Media Inc. (NYSE: TSQ)
Background
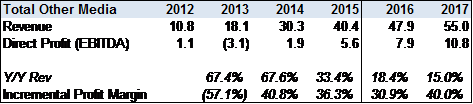
Townsquare Media (TSQ) is the owner-operator of 309 radio stations in 66 small and mid-sized markets in the United States, where it is the #1 or #2 largest broadcaster. Based in Greenwich, CT, Townsquare operates three segments, the largest of which, Local Advertising (70% of 2015 revenue, 88% of EBITDA) sells broadcast, digital, and mobile advertising for its stations and related online presences. The Live Events segment (22% revenue/7% EBITDA) operates 650 Live Events per year from music festivals and fun runs to beer festivals and wedding expos. The Other Media segment (8% revenue/ 5% EBITDA) is comprised of Townsquare Interactive, a subscription marketing business for website design for small and mid-sized businesses in local markets, and Townsquare Media, 16 owned and operated music websites and the largest music digital ad network in the US on over 150 sites with 60 million unique visitors.
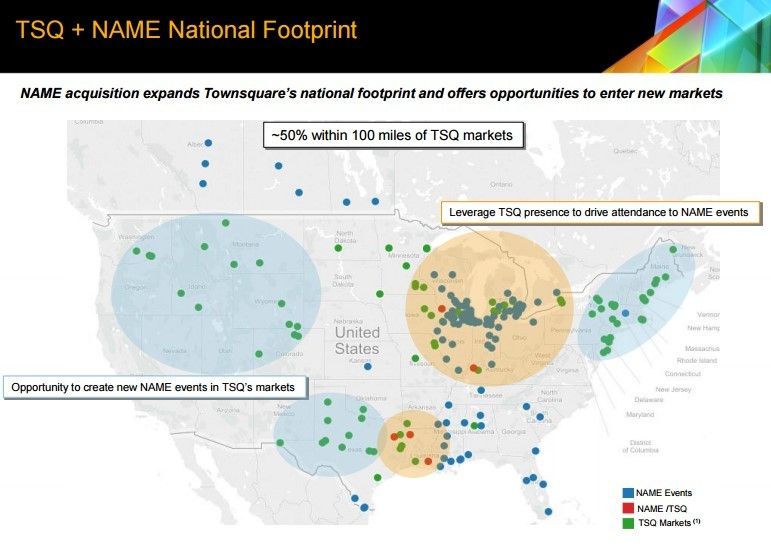
Although its primary business is radio, TSQ has placed a greater emphasis on investing in its Live Events segment as Americans increasingly spend on experiences. As part of this strategy, Townsquare recently completed the acquisition of North America Midway Entertainment (“NAME”), the largest operator of fairs and festivals in North America, including 11 of the top 50 fairs. TSQ has also invested in its existing events, which include music festivals and fun runs, to build annual franchises like Coachella and Bonnaroo and traveling events like Spartan Race and The Color Run. Both the recent acquisition, completed in NAME’s seasonally slow period, and the additional investment in festivals and fun runs negatively impacted profitability, masking Townsquare’s true earnings power.
In contrast to expectations of a slow, secular decline, we believe that the radio business will continue to generate sizeable, consistent cash flow allowing TSQ to invest in the faster growing and high return Live Events and Other Media businesses. We expect earnings to grow in excess of 10% each of the next four years by which time the company would generate $300M in free cash, which is 5% more than the current market value.
Reason for Mispricing
§ Negative Industry Perception
Traditional media ad revenue in decline as spend shifts to digital
§ Turnover in Shareholders
Investors at the IPO believed TSQ was organized solely to roll-up assets in the radio industry
§ Performance Decline in 2015
EBITDA margin declined 330bps, the company missed 2015 Guidance and issued poor 2016 guidance, causing stock to fall 9%
§ Levered Balance Sheet
5.4x as of December 2015
§ Unusual Class Structure
Company has A, B, C share classes, warrants, and controlling shareholders Oaktree (45% owner), GE Capital (12%), and MSD Capital (6%)
§ Recent JOBS Act IPO
Often viewed as lower quality businesses
§ Capital Allocation to Uncertain Business Segment
Live Events is lower margin with unproven economics and does not have publicly-traded peers
Local Advertising Business Stability
Contrary to popular belief, digital advertising is not eating radio advertising’s lunch. According to data from Miller Kaplan, total radio advertising revenue growth has been essentially flat over the past five years, while BIA/Kelsey projects category growth.
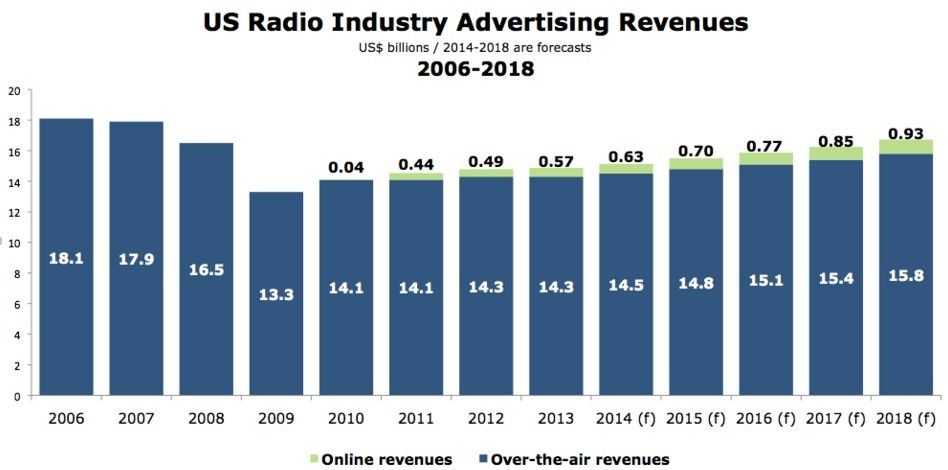
Source: BIA/Kelsey, Marketingcharts.com
While “spot,” or on-air advertising, has declined an average of 1.4% since 2010, digital and off-air advertising have increased 10.5% and 8.0%, respectively. TSQ has successfully outperformed the industry, growing organic, ex-political advertising an average of 1.8% over the past three years.
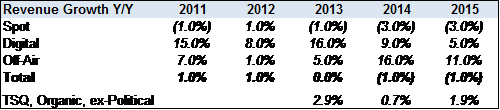
Revenue Descriptions: Spot refers to traditional :30 and :60 spots on a market-by-market basis; Digital is website, mobile, and streaming; Off-Air is events, signage, concessions, and sponsorships.
Source: Miller Kaplan, Company filings
TSQ’s advantage comes from its dominant market share in small and mid-sized markets, which feature less competition, less volatility, and the ability to leverage national experience at a local level.
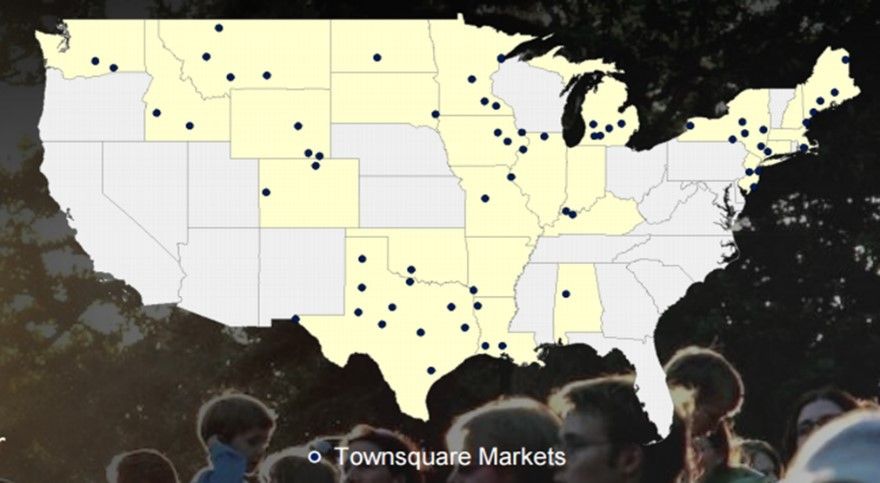
Source: Company presentation
Specifically, in 43 of 66 markets, TSQ does not compete against any of the five largest English language national radio competitors. In contrast to national advertisers, which direct spending based on Nielsen listener counts, local advertisers spend based on a specific advertisement’s impact on their business. Furthermore, local advertising is less susceptible to swings in unemployment, housing prices, and the stock market. These factors have driven the outperformance of local advertising vs. national across radio broadcasters.
The radio business is attractive because it is a stable cash generator requiring little capital investment. Returns on tangible assets have averaged 30% over the past decade for TSQ’s peer group with EBITDA margins at 23%.
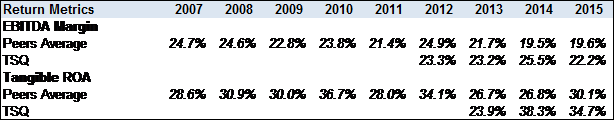
Peers include: ETM, CMLS, SALM, EMMS, BBGI
Source: Company filings
Live Events Opportunity
As Americans spend disproportionately more on experiences over physical items, demand for live events has increased significantly over the past several years. According to IBISWorld, total revenue from the U.S. live event industry, ranging from concerts and theater performances to state fairs and air shows, grew to $25B in 2015, up from $20B in 2010, a 4.7% CAGR. With more than a half-dozen multi-day music festivals and over 100 obstacle races and similar events, TSQ’s Live Events segment is poised for significant growth. In addition to the secular attendance growth of live events, we believe there are other opportunities to accelerate revenue growth
Festival Ticket Pricing
Though much smaller than industry giants, Live Nation and AEG, TSQ possesses a solid portfolio of multi-day music festivals, the largest of which, Country Jam in Grand Junction, CO, attracts over 80,000 attendees annually. Similar to peers, TSQ is cashing in on the shift to more profitable festivals, relative to standard concert venues, and further consolidating the festival space to leverage fixed assets, raise prices, and garner a greater share of sponsorship dollars. The growth of Goldenvoice/AEG’s country festival Stagecoach is just one example of demand for country festivals in particular. In 2015 Stagecoach grossed over $21.9M in ticket sales with 210,000 visitors over three days, up from $18.6M and 190,000 attendees just one year prior. In 2014, according to Nielsen Music, 32M people attended music festivals, of which 14.7M were millennials, a key target demo for advertisers. And according to IEG, North American-based companies spent more than $1.5 billion sponsoring music venues, festivals and tours in 2014, up from $1.1B in 2009, a 6.8% CAGR.
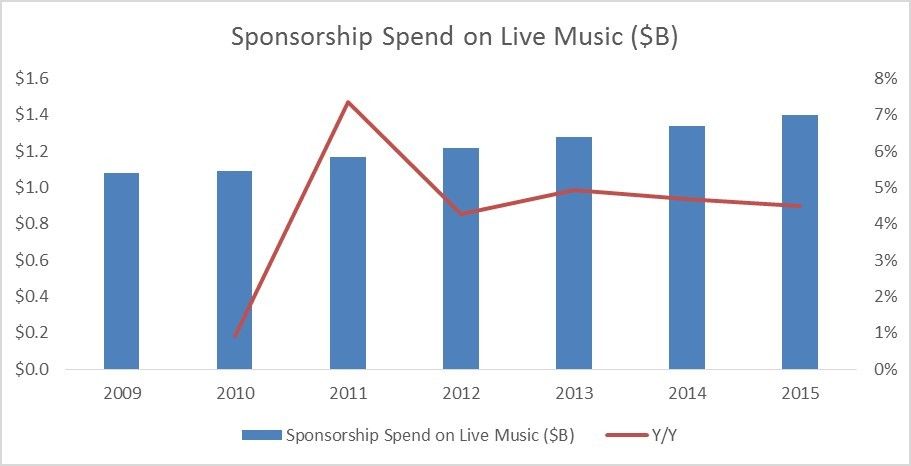
Source: IEG Research
While increased attendance and sponsorship will serve as a tailwind for TSQ, we believe the most overlooked growth driver for its festivals is ticket pricing. TSQ’s 2014 purchase of WE Fest provides a great example of the pricing opportunity available to TSQ. The 3-day event in Minnesota, which draws 50,000 annually was acquired in October 2014 for $22M. With the ability to control ticket pricing for the 2016 festival, TSQ raised prices 23% for a 3-day GA pass to $159 while adding extra paid services such as shuttles and showers.
While WE Fest is the most prominent example of raising ticket prices, our research shows TSQ is capitalizing on its 2015 investment year to push price increases across several of its festivals.
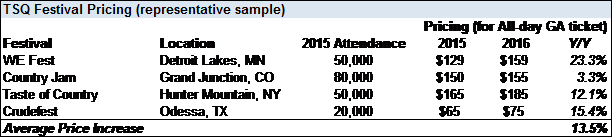
Source: Event sites
Events in a Box Expansion
In addition to music festivals, TSQ produces what it calls Events in a Box. These concepts leverage fixed equipment assets to conduct multiple events in different cities. In the case of TSQ’s Insane Inflatable 5K concept, a crew hauls inflatable obstacles to Nashville, TN, for example, sets up shop for over 1,000 participants to run through the 5K course, breaks it down, and drives to Tulsa, OK to repeat the process the next weekend. For 2016, TSQ has three separate crews conducting three events nearly every weekend for a total 115 events, up from 70 in 2015 and 18 in 2014. With this concept, TSQ has tapped into the general growth of non-traditional races, which RunningUSA estimates increased 40x to 4M finishers in 2013 from 2009. Looking forward, Obstacleraceworld projects 5.3M races participants in 2016, up 8.1% from 2015.

Source: Insane Inflatable 5K site
TSQ invested heavily in 2015 to grow Insane Inflatables and two other Event in a Box concepts. In 2016, TSQ will roll-out a replica of Insane Inflatables with a different demographic target in Krazy Kids Inflatable Fun Run, which can bring in demo-specific sponsors. Capitalizing on the craft beer craze in the US, America on Tap is TSQ’s national craft beer tour, which TSQ acquired in 2013. The company accelerated growth to 40 events in 2014 from 15 in 2013 and expects to produce more than 60 events in 2016. These four concepts alone will drive significant growth for the Live Events segment.
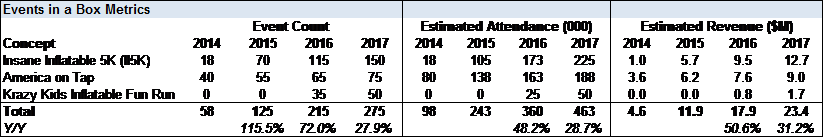
Source: Event sites and Facebook, AJ Bodden, internal estimates
We believe TSQ will deliver growth beyond 2017 with new concepts that are currently in testing and will roll-out with very attractive margins. With ticket prices ranging from $30-$100 and relatively low upfront asset costs and event-specific expenses (no earth-movers required), it is no surprise that TSQ expects “mid-to high 20s margin, as you roll out events.” (Source: CEO, Steven Price, March 2016 Deutsche Bank Media, Internet & Telecom Conference)
Sponsorship at NAME Fairs
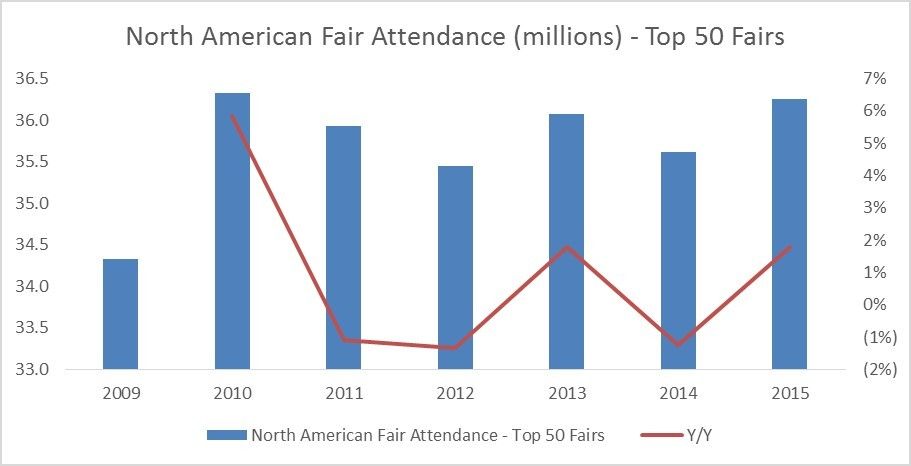
In September 2015, TSQ paid $75M to acquire North American Midway Entertainment (NAME), an operator of carnival rides, games, and concessions. NAME is a steady earner with stable LSD growth. The company has not lost a contract in 15 years and recently booked a new contract win with the Tulsa State Fair in 2016 (the 11th largest fair in North America with 1.2M attendees).
Source: CarnivalWarehouse.com
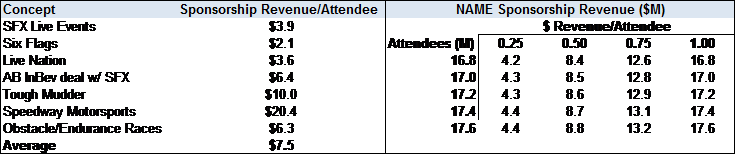
Despite reaching over 16M fair goers each year at over 150 events, including 11 of the top 50 fairs in North America, NAME has not sold a single dollar in sponsorships. We believe TSQ has the ability to leverage its existing salesforce to generate highly profitable sponsorship revenue beginning in 2017.
Source: Company presentation
Sponsorship by a carnival operator would be new for the industry so we looked to other entertainment events for to frame-up the opportunity. Our comparable analysis leads us to a potential revenue per attendee range of $2-$20, which we believe must be significantly discounted to account for the peculiarities of NAME’s opportunity. Specifically, NAME would be selling sponsorship of its rides, games, and concessions, not on-site signage, sampling, and public addresses that are sold by the state fair board. We conservatively estimate NAME could generate $0.25-$1.00 per attendee, which would generate ~$11M in 2017. This figure seemed reasonable to TSQ management and other fair operators we spoke to, and would represent only 10% of NAME revenue.
Source: Various news sources, internal estimates
Conclusion
All in, we believe these three factors combined with a tailwind of increasing demand support significant revenue growth in the Live Events segment. Given the high-margin nature of these incremental revenue streams, we expect direct profit contribution from the Live Events segment to double over the next two years.

Source: Company filings, internal estimates
Positive Optionality
TSQ’s third segment, Other Media, turned the corner in 2015 as the digital ad network turned profitable, joining Townsquare Interactive, which was in the black in 2014. Both segments are growing, but the main driver is Interactive, which grew its user base by 60% to 8,000 subscribers in 2015. TSQ has leveraged its existing relationship with local advertisers to capitalize on the growing trend of web design services, which IBISWorld estimates grew at a 4.9% CAGR over the past five years to $24B in the US. We expect continued growth in these services, particularly since only 53% of small businesses had websites in 2014 according to eMarketer. With only a small fraction of the total addressable subscriber base on board and attractive incremental margins, we expect segment profit to double over the next two years.
Source: Company filings, internal estimates
The Other Media segment also includes TSQ’s 16 owned and operated music and entertainment sites, including PopCrush, Fanpop, and Taste of Country, and the largest music digital ad network in the US. The recent acquisitions of Cracked ($39M) and Complex Media ($250M-$300M) underscore the value attributable to significant web properties.
An even-numbered year means political revenue for TSQ. And while the revenue impact of political is well understood, we believe analysts are not crediting TSQ with the proper margin for these sales. Excluding a 20% commission, the additional $8M in sales from political in 2016 should generate ~$7M in segment profit, which alone bridges the gap from 2015 pro forma EBITDA of $103M to 2016 consensus of $110M. With additional contributions from Live Events and Other Media we believe expectations for 2016 are significantly underestimated.
One of the most difficult qualities to find in the small-cap universe is a talented management team, but that is exactly what we find at TSQ. CEO Steve Price was CEO of publicly traded PriCellular and led the company’s sale for more than $1B in 1998. Price’s executive team includes professionals with private equity and TMT banking backgrounds while the board’s three independent directors are Oaktree professionals. We have faith in this group’s capital allocation ability, which has been validated by their unwillingness to stretch for radio acquisitions that do not meet their criteria. Oaktree’s open market purchases in 2Q14 at $10.50-$11.00 per share provide a solid endorsement. Finally, management is highly incentivized to increase TSQ’s share price with ownership of 6% of shares and over 3M options exercisable at $11 each.
Valuation
We believe TSQ is not getting credit for its expected 2016 performance due to the miss on 2015 expectations and the decline in pro forma results. Additionally, the market is taking a cautious approach on the Live Events business – discounting both the full year contribution of NAME and a rebound in performance. We believe the street’s conservative estimates already make TSQ attractive; however, with the outperformance we expect over the next two years, TSQ is an undeniably compelling risk/reward opportunity. Using peer EV/EBITDA multiples, the stock is worth closer to $17 or 68% upside.
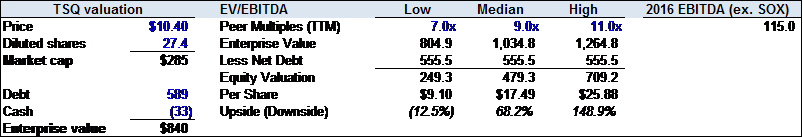
Source: Company filings, internal estimates
Note, TSQ has significant tax shields to avoid cash tax payments until 2020, which is why we prefer to use a multiple of FCF. At a 23% forward FCF Yield, TSQ is valued as if it’s going out of business, while in reality it is the market leader in businesses that have been around for over 100 years and have seen their popularity stabilize (radio) or increase (events) over the past 5 years. By applying a peer FCF yield of 9%, TSQ’s fair value is closer to $26, or more than 150% upside. With a growth profile that is more attractive than its peers, we believe applying a peer FCF yield of 9% is conservative. We believe TSQ can generate FCF of $65M in 2016 and grow it at a 10% CAGR to $95M in 2020.
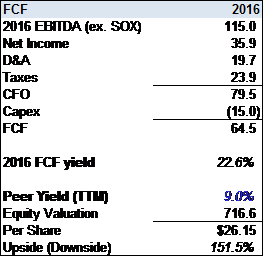
Source: Company filings, internal estimates
Catalysts
2016 Earnings Power
While the valuation implies expectations are unachievable, we expect TSQ to deliver outperformance relative to consensus and Management guidance. We believe the market is fixated on the recent performance drag from Live Events, which featured an investment in existing events and the seasonal low earnings from the NAME acquisition. As TSQ delivers above expectations, the market will begin to recognize its true earnings power and award it a valuation of a growing, cash generative business.
Radio Acquisition
While radio acquisitions have been difficult to come by, such a transaction would be attractive as most of these potential deals would be from distressed sellers generating returns as high as 30%.
Deleverage
The company will pay down debt to end the year with a net leverage ratio of 4.0x-4.5x, which could draw in more risk averse investors.
Downside Protection
Replacement Value
We believe the market does not fully appreciate TSQ’s assets, which we believe would take over $1B to replace, well above the current enterprise value of $865M. Furthermore, our estimate of replacement value is likely conservative in light of the fact that several assets were acquired at distressed levels.
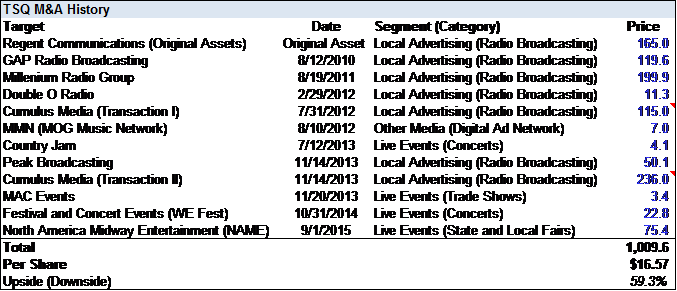
Source: Company filings
Risks
§ Decline in local advertising
§ Underperformance of Live Events segment
§ Integration issues with NAME
§ Weather factors at major events
I and/or others I advise hold a material investment in the issuer's securities.
Catalyst
2016 Earnings Power
While the valuation implies expectations are unachievable, we expect TSQ to deliver outperformance relative to consensus and Management guidance. We believe the market is fixated on the recent performance drag from Live Events, which featured an investment in existing events and the seasonal low earnings from the NAME acquisition. As TSQ delivers above expectations, the market will begin to recognize its true earnings power and award it a valuation of a growing, cash generative business.
Radio Acquisition
While radio acquisitions have been difficult to come by, such a transaction would be attractive as most of these potential deals would be from distressed sellers generating returns as high as 30%.
Deleverage
The company will pay down debt to end the year with a net leverage ratio of 4.0x-4.5x, which could draw in more risk averse investors.
| show sort by |